Mainz for investors: A 2026 comparison of all 15 city districts
For existing flats, there is a difference of around €1,350 per square metre between the city centre and Marienborn. The Mietspiegel (rent index) only differentiates between residential areas by just over one euro. We compare the 15 city districts using official figures and run the numbers for the same flat in three different locations.
 Eduard Winter
Investment Advisor at InvestImmo
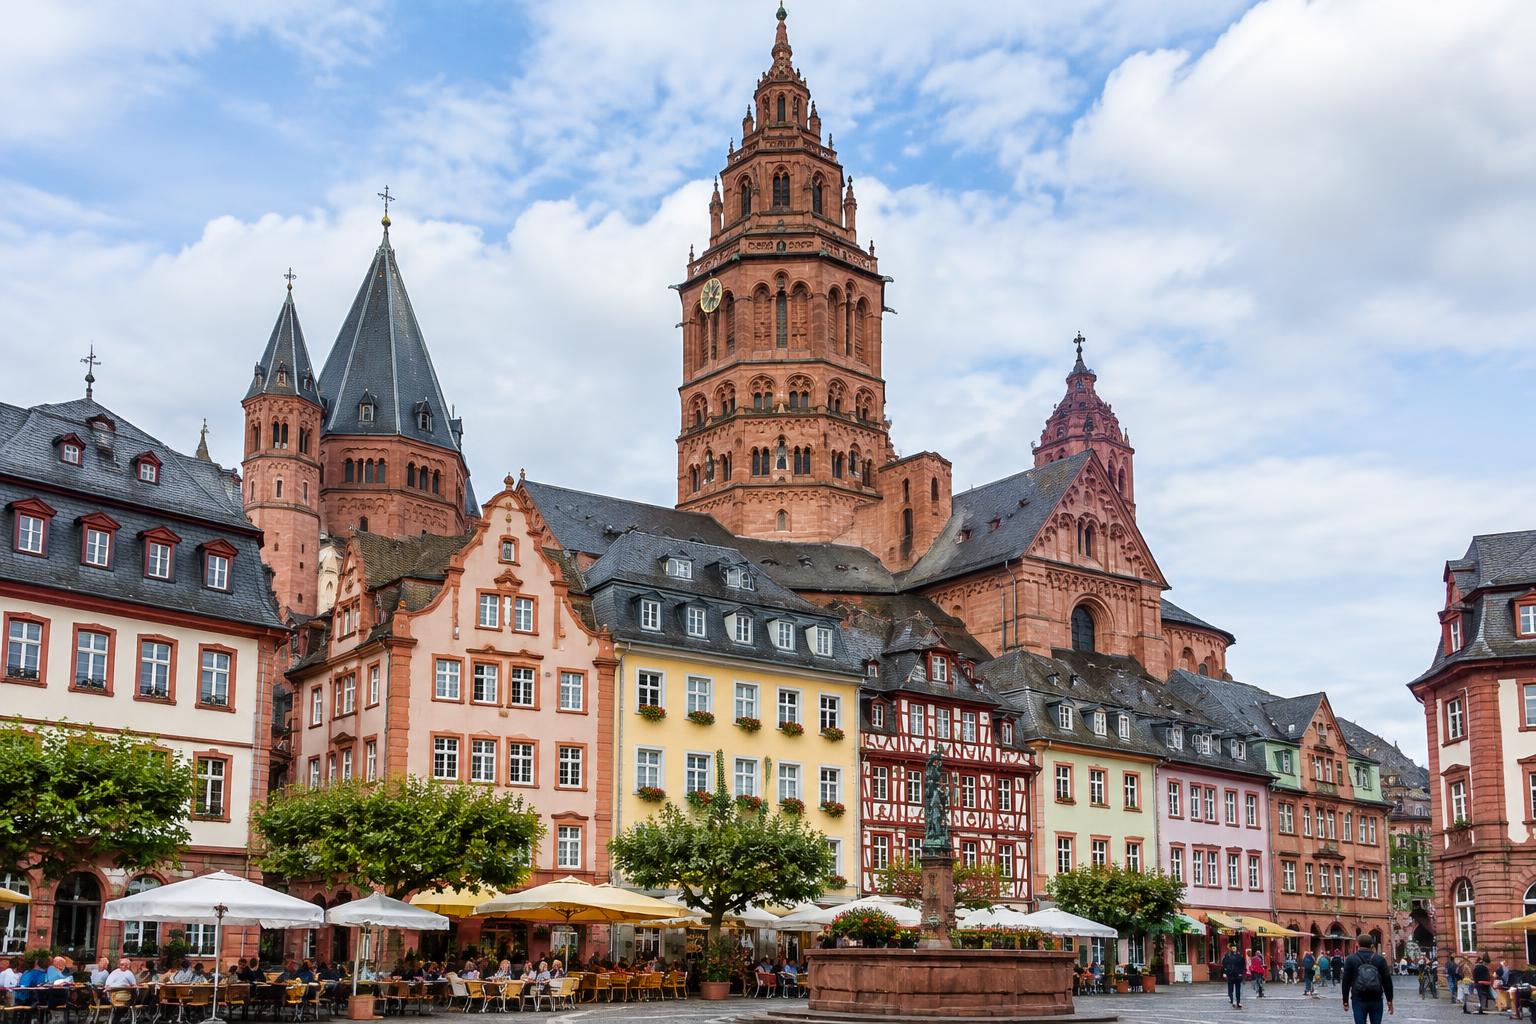
You've decided on Mainz. The next question is where: Neustadt or Oberstadt, Gonsenheim or Bretzenheim, Weisenau or Finthen? Mainz has 15 districts. Four of them form the city centre: Altstadt, Neustadt, Oberstadt and Hartenberg-Münchfeld. Around 40% of all residents live there. The remaining eleven are former villages and newer settlements between the Rhine and the Rheinhessen region.
For landlords, a second point is important. In Mainz, the Mietpreisbremse (rent brake) is in effect until the end of 2029, and the Mietspiegel (rent index) makes little distinction between residential areas: a good location brings in €1.13/m² more than an average one, and a basic location €0.20/m² less. In contrast, the purchase prices of existing flats can differ by up to 50% between districts.
We compare all 15 districts using official figures from the city's statistics office and the Valuation Committee. This is not a ranking, nor is it a judgement on the people who live there. At the end, we will run the numbers for the same flat in three different locations, both before and after tax.
01Mainz in 15 districts: the comprehensive comparison table
This table summarises the most important official key figures for each district. All data comes from the City of Mainz statistics office.
| District | Population 2025 | Change since 2015 | Single-person households | 18 to 29 years | 65 years and older | Unemployment density 2024 |
|---|---|---|---|---|---|---|
| Altstadt | 18,051 | +3.1% | 69.4% | 29.1% | 15.2% | 4.4% |
| Neustadt | 30,624 | +11.0% | 64.7% | 26.5% | 11.1% | 5.1% |
| Oberstadt | 23,506 | +8.6% | 53.7% | 23.1% | 17.2% | 5.5% |
| Hartenberg-Münchfeld | 19,270 | +11.9% | 56.5% | 29.4% | 15.3% | 5.4% |
| Mombach | 13,824 | +1.1% | 48.0% | 16.8% | 18.0% | 7.0% |
| Gonsenheim | 25,235 | +3.6% | 45.1% | 16.6% | 21.4% | 4.6% |
| Finthen | 14,616 | +1.1% | 43.7% | 13.1% | 24.0% | 5.5% |
| Bretzenheim | 19,811 | ±0.0% | 52.0% | 21.3% | 19.2% | 3.8% |
| Marienborn | 4,532 | +3.6% | 49.7% | 17.6% | 17.1% | 7.5% |
| Lerchenberg | 6,761 | +8.9% | 43.5% | 13.2% | 22.5% | 7.9% |
| Drais | 3,094 | −2.3% | 44.2% | 12.5% | 29.1% | 2.5% |
| Hechtsheim | 15,574 | +1.7% | 44.4% | 13.3% | 23.6% | 4.2% |
| Ebersheim | 6,066 | +6.1% | 33.4% | 11.1% | 22.6% | 4.9% |
| Weisenau | 16,261 | +34.5% | 44.9% | 19.4% | 14.9% | 5.8% |
| Laubenheim | 9,168 | −0.6% | 45.2% | 13.8% | 24.1% | 4.2% |
| Mainz | 226,393 | +6.6% | 52.9% | 20.5% | 18.2% | 5.1% |
Resident population (primary and secondary residence) on 31 December 2025, change compared to 31 December 2015; 2025 includes register adjustment, so comparability is limited. Single-person households: share of residential households on 1 January 2026, excluding halls of residence. Age groups as a share of all inhabitants. Unemployment density: unemployed persons on 31 December 2024 per inhabitant aged 21 to under 61, not comparable with the unemployment rate.
Two things stand out. Since 2015, Weisenau has grown by more than a third, more than any other district, mainly due to new residential quarters. And in Altstadt and Neustadt, almost two out of three households are single-person households, whereas in Ebersheim it's only one in three.
02Purchase prices and property yield rates per district
The Valuation Committee analyses the notarised purchase agreements and publishes average prices for existing freehold flats for each Gemarkung (cadastral area). The current market report is based on 957 sales in 2023 and 2024, excluding prime locations, studio flats and parking spaces. The Mainz cadastral area covers the four city-centre districts; there is no separate figure for Lerchenberg.
| Cadastral Area | Avg. purchase price 2023–2024 | Sales | Property yield rate |
|---|---|---|---|
| Mainz (Altstadt, Neustadt, Oberstadt, Hartenberg-Münchfeld) | €4,066/m² | 242 | 0.65% |
| Drais | €4,239/m² | 16 | 1.71% |
| Weisenau | €3,937/m² | 27 | 1.89% |
| Ebersheim | €3,775/m² | 10 | 2.07% |
| Laubenheim | €3,652/m² | 41 | 2.16% |
| Hechtsheim | €3,586/m² | 85 | 1.75% |
| Gonsenheim | €3,547/m² | 257 | 1.36% |
| Bretzenheim | €3,423/m² | 117 | 1.25% |
| Mombach | €3,293/m² | 30 | 1.43% |
| Finthen | €3,170/m² | 105 | 2.03% |
| Marienborn | €2,710/m² | 27 | 2.47% |
| Mainz total | €3,623/m² | 957 | 1.35% |
Valuation Committee for Property Values for the City of Mainz Area, Property Market Report 2025: Resales of freehold flats 2023–2024, arithmetic mean of all construction years; property yield rates by district, excluding studio flats.
The property yield rate shows how much buyers pay for one euro of rent. In the city centre, it is only 0.65%; buyers there are primarily paying for the location. In Marienborn, Laubenheim, Ebersheim and Finthen, it is over 2%, meaning that rental income is acquired more cheaply. Bretzenheim and Gonsenheim are in between.
The year of construction also matters. City-wide, flats from 1970 to 1980 cost an average of €2,992/m², the cheapest construction age bracket, while flats from 2003 to 2015 cost around €4,540/m². In the prime locations of the city centre, buyers paid an average of €7,010/m²; these sales are not included in the figures above.
03Rents: what the 2025 rent index stipulates
Mainz has a qualified Mietspiegel (rent index), in force since 9 April 2025. It is an update of the 2023 rent index based on the consumer price index. It provides median rents according to year of construction and flat size for properties in an average location with standard fittings, i.e. with a bathroom and central heating.
| Year of construction and size (Rent Index 2025) | Median | Range (2/3 of rents) |
|---|---|---|
| 1961 to 1977, up to 40 m² | €12.48/m² | €9.83 to €14.47/m² |
| 1961 to 1977, 40 to 60 m² | €10.78/m² | €8.18 to €13.75/m² |
| 1961 to 1977, 60 to 80 m² | €9.27/m² | €7.39 to €11.32/m² |
| up to 1948, 40 to 60 m² | €10.54/m² | €7.06 to €12.89/m² |
| 2016 to October 2022, 40 to 60 m² | €14.07/m² | €11.59 to €16.88/m² |
City of Mainz, Qualified Rent Index 2025, rent index table. For flats in a good residential area, €1.13/m² is added; in a basic residential area, €0.20/m² is deducted; with average fittings, €0.90/m² is deducted.
The residential area category for a specific address can be found on the City of Mainz's online map using the "Mietspiegel" layer. The classification is based on a scientific evaluation of location qualities in three categories.
Enter the purchase price and actual rent, and the calculator will show the gross and net rental yield.
04Population, households and the labour market by district
For landlords, who lives in a district and how they live is what counts. Between the end of 2015 and the end of 2025, Mainz's resident population grew from around 212,300 to around 226,400 (+6.6%). Besides Weisenau, Hartenberg-Münchfeld (+11.9%), Neustadt (+11.0%), Lerchenberg (+8.9%) and Oberstadt (+8.6%) have grown the most. Drais and Laubenheim have seen a slight decline.
Most people living alone reside in the city centre: 69.4% of households in Altstadt and 64.7% in Neustadt are single-person households. In Hartenberg-Münchfeld, near the university, almost one in three residents is between 18 and 29 years old. In the districts on the outskirts, such as Ebersheim, Finthen or Hechtsheim, it is less than one in six, and around a quarter of the population is 65 or older.
Regarding social structure, we only provide official figures. The unemployment density calculated by the statistics office at the end of 2024 ranged from 2.5% in Drais to 7.9% in Lerchenberg, with Marienborn at 7.5% and Mombach at 7.0%. This describes differences in the tenant population, not the quality of the districts. For your letting business, what matters is the individual household, which you should vet during the tenant selection process.
05Four location types for buy-to-let investors
Instead of a ranking, we group the districts into four types. Each type is suited to different investors.
Type 1: the city centre
Altstadt, Neustadt, Oberstadt and Hartenberg-Münchfeld cost an average of around €4,070/m², with a property yield rate of only 0.65%. Around 91,000 people live here, including the most people living alone and many students from the Johannes Gutenberg University and the University of Applied Sciences. Neustadt and Hartenberg-Münchfeld have grown by around 11% to 12% since 2015.
- You want to let small flats to students and professionals.
- You are using a lot of equity and plan to hold the property for a long time.
- Broad demand is more important to you than ongoing returns.
- You expect a surplus from the rental income.
- You are counting on prime-location prices and rents from property listings.
Type 2: the districts near the campus and in the north-west
Bretzenheim and Gonsenheim are priced at around €3,420 and €3,550/m², with the highest number of sales outside the city centre. Bretzenheim borders the university campus, and a good one in five residents is between 18 and 29. Gonsenheim, with around 25,000 inhabitants, is the second-largest district and tends to be characterised by families and older residents. The property yield rate is around 1.3%.
- You want to let to students, university staff and couples.
- You are looking for a mid-range entry price with plenty of comparable sales.
- You check the property's specific residential area on the city map.
- You are looking for the lowest entry price.
- You expect every address to be close to the city centre.
Type 3: the southern districts on the Rhine
Weisenau, Laubenheim, Hechtsheim and Ebersheim are priced between around €3,590 and €3,940/m². Weisenau has grown significantly with new residential quarters, while Hechtsheim has a large commercial area. The property yield rate is between 1.75% and 2.16%, noticeably higher than in the city centre. In Laubenheim and Ebersheim, where there are few sales, each individual case must be carefully examined.
- You want to let newer flats to couples and families.
- You want to attract commuters who work for employers in the commercial area.
- You carefully check the construction year, service charge and sinking fund of a newer development.
- You are primarily looking for students as tenants.
- You do not want to work with a small number of comparable sales.
Type 4: the west and north
Finthen, Mombach, Marienborn and Lerchenberg are priced between around €2,710 and €3,290/m², with no separate figure for Lerchenberg. Mombach on the Rhine has industry, while Lerchenberg is a housing estate from the 1960s and 1970s. The unemployment density is between 5.5% and 7.9%, with Lerchenberg and Marienborn having the highest rates in the city. The property yield rate is also highest in Marienborn at 2.47%. A low purchase price here does not automatically mean a higher return.
- You are looking for a lower entry price and base your calculations on the rent index.
- You are very familiar with the building, the homeowners' association and the street.
- You have experience in letting and property management.
- You are buying a flat for the first time and have little time.
- You equate a low price with a high return.

06Sample calculation: the same flat in three locations
Let's take Sarah. She is an employee, single, and has a taxable income of €60,000. She buys a tenanted two-room flat of 55 m², built between 1961 and 1977, and compares three locations: the city centre, Bretzenheim and Marienborn. The name is fictional; the figures are a sample calculation and not a forecast.
For the purchase price, we use the average price for the cadastral area in 2023 and 2024 according to the Valuation Committee. For the rent, we use the rent index: €10.78/m² for 40 to 60 m² and construction between 1961 and 1977, in an average residential area, the same for all three locations. For a new letting, up to 10% more would be permitted.
| City centre | Bretzenheim | Marienborn | |
|---|---|---|---|
| Purchase price per m² (avg. sales 2023–2024) | €4,066 | €3,423 | €2,710 |
| Purchase price 55 m² | €223,630 | €188,265 | €149,050 |
| Grunderwerbsteuer (property transfer tax) 5.0% | €11,182 | €9,413 | €7,452 |
| Notary and land registry (approx. 1.8%) | €4,025 | €3,389 | €2,683 |
| Total costs | €238,837 | €201,067 | €159,185 |
| Basic rent per m² (Rent Index 2025) | €10.78 | €10.78 | €10.78 |
| Annual basic rent | +€7,115 | +€7,115 | +€7,115 |
| Service charge, non-apportionable | −€924 | −€924 | −€924 |
| Interest (3.8%) | −€8,498 | −€7,154 | −€5,664 |
| Principal repayment (2%) | −€4,473 | −€3,765 | −€2,981 |
| Cash flow before tax | −€6,780 | −€4,728 | −€2,454 |
| Depreciation 2% on 75% of total costs | €3,583 | €3,016 | €2,388 |
| Taxable result from letting | −€5,428 | −€3,517 | −€1,399 |
| Tax savings (2026 tariff) | +€2,043 | +€1,336 | +€537 |
| Cash flow after tax | −€4,737 | −€3,392 | −€1,917 |
| per month | approx. −€395 | approx. −€285 | approx. −€160 |
| Gross rental yield | 3.2% | 3.8% | 4.8% |
In all three locations, Sarah has to contribute money every month. In the city centre, it's around €395 after tax, of which around €375 is principal repayment that reduces her outstanding debt. In Marienborn, it's around €160 with around €250 in principal repayment; without the repayment, there would be a small surplus.
Why is the city centre so much more expensive to maintain? The purchase price there is around 50% higher than in Marienborn, while the comparative rent is the same for an identical residential area category. If the flat in the city centre were in a good residential area, another €1.13/m² would be added. The monthly contribution would then fall to around €355, still significantly higher than in Bretzenheim.
This calculation does not recommend one location over another. It shows how much the purchase price affects the result when the rent index keeps rents within a narrow band. The average prices mix different years of construction: a flat from the 1970s costs around €3,000/m² city-wide, so it could be cheaper in the city centre than the average suggests. In Marienborn, the monthly contribution is the smallest, but you also bear more letting risk. Our guide on tax on rental income shows how much tax you can save at your income level.
07Risks in choosing a location in Mainz
Every location has its own risks. Some apply to all of them.
- Averages vs. individual cases: The figures for each cadastral area mix construction years and sizes; in Drais, Ebersheim and Weisenau, they are based on fewer than 30 sales. The average is a starting point, not a price for your specific flat.
- Outdated market data: The prices are from 2023 and 2024; the 2026 market report has not yet been published.
- Rent brake and rent index: The regulation is valid until 31 December 2029, and the 15% rent cap until 30 September 2029. The current rent index is an update; the next edition is supposed to be based on a new survey.
- Student demand: Small flats in the city centre and Bretzenheim depend on the university and the university of applied sciences. More frequent tenant changeovers cost time and money.
- Interest rates: With gross yields between 3.2% and 4.8%, every percentage point change in interest rates has a major impact on the calculation.
- Old building stock: Many affordable flats date from the 1960s and 1970s. New windows, pipes or heating systems will affect the sinking fund and service charges.
08Other locations
You can find the figures for Mainz as a whole, the rules for landlords and a new-build calculation on our page Buy-to-let properties in Mainz. We compare the districts of the neighbouring city in Wiesbaden for buy-to-let investors: a comparison of the districts, and those of Frankfurt am Main as well. Other cities in the state are covered in our Rhineland-Palatinate overview, and all cities in the City Comparison 2026.
FAQFrequently asked questions
Which district of Mainz is best for buy-to-let investors?
There is no single best district. The city centre has the most single-person households and students, but also the highest prices. Bretzenheim and Gonsenheim are in the middle range, with many comparable sales. In Marienborn, Finthen and Mombach, the entry point is more affordable, but more care is needed when selecting the building and tenants. Your budget, your holding period and the individual flat are the decisive factors.
Where are flats in Mainz cheapest?
In 2023 and 2024, Marienborn had the lowest average prices for existing flats at around €2,710/m², followed by Finthen (around €3,170/m²) and Mombach (around €3,290/m²). Drais and the city centre had the highest prices.
How many districts does Mainz have?
Mainz has 15 city districts, which are also Ortsbezirke (local districts) with their own Ortsbeirat (local advisory council). The Gutachterausschuss (property valuation committee) groups the Altstadt, Neustadt, Oberstadt and Hartenberg-Münchfeld districts into the Gemarkung (cadastral area) of Mainz.
Is there rent control in Mainz?
Yes. The Mietpreisbegrenzungsverordnung (Rent Price Limitation Ordinance) of Rhineland-Palatinate applies to Mainz until 31 December 2029. For existing contracts, a Kappungsgrenze (capping limit) of 15% over three years applies until 30 September 2029.
What is the rental yield in the districts of Mainz?
In our sample calculation using rents from the Mietspiegel (rent index), the gross rental yield is between 3.2% in the city centre and 4.8% in Marienborn. According to the Gutachterausschuss (property valuation committee), the Liegenschaftszins (capitalisation rate) is 0.65% in the city centre and 2.47% in Marienborn.
Is a flat in Gonsenheim a worthwhile buy-to-let investment?
With 257 sales, Gonsenheim has the most comparable cases outside the city centre and had prices of around €3,550/m² in 2023 and 2024. The unemployment density is below the city average, while the proportion of older people is above it. Even with rent at the Mietspiegel (rent index) level, a flat here requires a monthly top-up from the owner. It is more suited to investors looking for longer-term tenancies with couples and families.
Which districts of Mainz are growing?
Between the end of 2015 and the end of 2025, Weisenau grew the most (+34.5%), followed by Hartenberg-Münchfeld (+11.9%), Neustadt (+11.0%) and Lerchenberg (+8.9%). Drais (−2.3%) and Laubenheim (−0.6%) saw a slight decline.
09Further reading
- Buy-to-let properties in Mainz: figures and locations
- A freehold flat as a buy-to-let investment: pros and cons
- Tax on rental income
- Rental Yield Calculator
- Property Purchase Cost Calculator
- Property transfer tax in Rhineland-Palatinate
10Sources
All sources accessed on 16 October 2026.
- Valuation Committee for Property Values for the City of Mainz Area, Property Market Report 2025 (reporting period 2024): Resales of freehold flats 2023–2024 by district and construction age bracket, property yield rates by district
- City of Mainz, Statistics Office, Population by district on 31 December 2025 and Statistical Yearbook 2025, Chapter 1: Area and Population (Tables 1.9, 1.24, 1.46)
- City of Mainz, Statistics Office, Statistical Yearbook 2024, Chapter 3: Employment and Labour Market (Tables 3.9, 3.10)
- City of Mainz, Qualified Rent Index Mainz 2025, in force since 9 April 2025
- City of Mainz, Housing Market Report 2025, April 2026 (Vacancy rate)
- Rhineland-Palatinate State Government, Rent Limitation Regulation of 16 September 2025, GVBl. 2025 No. 18, p. 538; Rent Cap Regulation, GVBl. 2024 p. 331
- § 32a EStG (German Income Tax Act) (2026 tariff), § 7 EStG (Depreciation), § 556d BGB (German Civil Code) (Rent brake), property transfer tax Rhineland-Palatinate 5.0%
- Shares, gross rental yields and sample calculation: own calculation, as of 16 October 2026
Disclaimer: This page provides general information and does not constitute investment, tax or legal advice. All figures are provided with their source and date; the sample calculation is based on disclosed assumptions and is not a forecast. As of 16 October 2026.
Writes about Taxes, AfA (depreciation), Existing properties and Portfolio building.
Since 2020, Eduard has bought seven properties of his own and supported more than 150 clients. He writes about tax levers, property documents and portfolio building – with honest numbers instead of rosy projections.
This guide does not replace tax or legal advice. All figures are example calculations with disclosed assumptions.