Chemnitz for Property Investors: A 2026 Comparison of All 39 Districts
In Chemnitz, the asking rents in the major districts differ by only around 70 cents. The differences in building stock, flat occupancy rates and population trends are much greater. We compare the districts using official figures and run the numbers for the same flat in three different districts.
 Eduard Winter
Investment Advisor at InvestImmo
You have considered Chemnitz as a location. Now the question is where in the city to buy. Kaßberg or Sonnenberg, Schloßchemnitz or a flat in the Heckert area? In Chemnitz, this question is more important than in most large cities. In the 2022 census, one in nine flats here was vacant.
Rents are of little help in making a decision. In November 2025, the asking rents for the large districts ranged from €5.66 to €6.39/m². The figures published by the city each year for all 39 districts are more meaningful: population, households, flats by year of construction and unemployment figures.
We compare the districts using these official figures, without a ranking, and conclude by calculating the pre-tax and after-tax figures for the same flat in three different districts.
01Chemnitz's districts at a glance
Chemnitz has 39 districts, including eight localities on the outskirts of the city. The two tables show the 21 districts with more than 5,000 inhabitants. Around 80% of Chemnitz's residents live there. The first table shows who lives there.
| District | Population 2024 | since 2015 | vs. previous year | Households | of which 1 person | Unemployed (share of 15–64 yrs) |
|---|---|---|---|---|---|---|
| Kaßberg | 18,617 | +3.6% | +0.9% | 10,510 | 53.6% | 5.9% |
| Sonnenberg | 16,845 | +15.7% | −0.9% | 9,430 | 57.1% | 13.5% |
| Zentrum | 16,092 | +24.7% | +1.4% | 8,950 | 59.1% | 12.3% |
| Gablenz | 15,311 | −1.8% | +0.5% | 9,100 | 55.1% | 7.9% |
| Bernsdorf | 14,449 | −1.9% | +0.7% | 7,600 | 59.3% | 5.8% |
| Schloßchemnitz | 13,909 | +1.5% | −1.2% | 7,870 | 56.3% | 8.2% |
| Altendorf | 11,915 | −2.3% | −0.5% | 6,810 | 56.1% | 6.6% |
| Markersdorf | 11,464 | −1.7% | −0.4% | 6,340 | 48.1% | 11.7% |
| Kappel | 9,729 | −1.0% | −1.3% | 5,700 | 56.1% | 10.9% |
| Ebersdorf | 7,172 | – | +0.5% | 3,190 | 45.1% | 3.6% |
| Hilbersdorf | 7,093 | +3.4% | +0.5% | 4,030 | 54.6% | 9.9% |
| Yorckgebiet | 6,861 | −4.3% | +0.5% | 4,130 | 57.1% | 11.3% |
| Borna-Heinersdorf | 6,544 | −1.1% | −1.3% | 3,390 | 42.8% | 4.0% |
| Adelsberg | 6,451 | +1.2% | −0.3% | 2,950 | 28.8% | 1.4% |
| Helbersdorf | 6,416 | +0.8% | +1.1% | 3,920 | 58.7% | 14.3% |
| Altchemnitz | 6,380 | +9.8% | +0.7% | 3,420 | 51.5% | 7.0% |
| Reichenbrand | 6,076 | −4.1% | −0.8% | 3,180 | 43.1% | 3.5% |
| Lutherviertel | 5,530 | +10.5% | +2.3% | 3,180 | 57.2% | 8.6% |
| Kapellenberg | 5,294 | −1.0% | +0.3% | 3,130 | 56.5% | 7.2% |
| Grüna | 5,134 | −4.6% | −0.8% | 2,610 | 39.5% | 2.0% |
| Hutholz | 5,092 | −2.7% | −0.8% | 2,840 | 53.9% | 11.6% |
| Chemnitz | 251,699 | +1.1% | +0.1% | 136,030 | 50.9% | 7.6% |
Population with main residence according to the registration office on 31 December 2024, change compared to 31 December 2015 and 31 December 2023. Households from the city's household generation model, rounded to the nearest ten. Unemployed persons on 31 December 2024 as a proportion of the population aged 15 to under 65, according to the Federal Employment Agency, not comparable to the unemployment rate. Ebersdorf shows no change since 2015 because the 2015 figure was inflated by an initial reception centre for refugees.
The second table shows what kind of flats are located there and how well they are occupied.
| District | Flats 2023 | Built by 1924 | Built 1970–1990 | Households per 100 flats |
|---|---|---|---|---|
| Kaßberg | 11,625 | 52% | 2% | 90 |
| Sonnenberg | 11,646 | 55% | 14% | 81 |
| Zentrum | 9,760 | 29% | 21% | 92 |
| Gablenz | 10,687 | 17% | 15% | 85 |
| Bernsdorf | 8,445 | 25% | 21% | 90 |
| Schloßchemnitz | 9,183 | 58% | 4% | 86 |
| Altendorf | 7,441 | 25% | 10% | 92 |
| Markersdorf | 7,307 | 2% | 88% | 87 |
| Kappel | 6,789 | 20% | 64% | 84 |
| Ebersdorf | 3,816 | 49% | 4% | 84 |
| Hilbersdorf | 4,983 | 56% | 2% | 81 |
| Yorckgebiet | 4,847 | 6% | 87% | 85 |
| Borna-Heinersdorf | 3,993 | 15% | 17% | 85 |
| Adelsberg | 3,282 | 10% | 8% | 90 |
| Helbersdorf | 4,706 | 1% | 94% | 83 |
| Altchemnitz | 4,023 | 38% | 1% | 85 |
| Reichenbrand | 3,602 | 25% | 10% | 88 |
| Lutherviertel | 3,979 | 26% | 0% | 80 |
| Kapellenberg | 3,428 | 8% | 25% | 91 |
| Grüna | 2,961 | 33% | 4% | 88 |
| Hutholz | 3,554 | 0% | 97% | 80 |
| Chemnitz | 158,521 | 29% | 24% | 86 |
Flats in residential buildings according to the city's building register on 31 December 2023, shares by year of building construction. Households per 100 flats: Households at the end of 2024 divided by flats at the end of 2023 (own calculation). This is only an approximation of the occupancy rate and not a vacancy figure, as shared flats, for example, count as a single household.
Two things are noticeable. Zentrum, Sonnenberg and Lutherviertel have grown significantly since 2015, while almost all other large districts have declined slightly. And in Sonnenberg, Hilbersdorf, Lutherviertel and Hutholz, there are only 80 to 81 households per 100 flats, compared to 90 to 92 in Kaßberg, Bernsdorf, Altendorf and the city centre.
02Purchase prices in Chemnitz
The Oberer Gutachterausschuss für Grundstückswerte im Freistaat Sachsen (Upper Valuation Committee for Property Values in the Free State of Saxony) analyses all purchase contracts. For Chemnitz, it publishes average values for the entire city in its "Schlaglicht Markt 2026" report, but no prices per district. In 2025, 1,180 condominiums were sold in Chemnitz.
Since the peak in 2022, resale prices have fallen by around 10%. In contrast, newly built flats cost around €5,110/m² in their initial sale in 2025. This means a new-build flat in Chemnitz is more than four times as expensive as a second-hand one.
Without official district prices, the building stock is the best indicator. In Kaßberg, Schloßchemnitz, Sonnenberg and Hilbersdorf, more than half of the flats date from the period up to 1924. In Markersdorf, Helbersdorf, Hutholz and Yorckgebiet, 87% to 97% of the buildings are Plattenbau (prefabricated concrete slab buildings) from the years 1970 to 1990. A refurbished Gründerzeit building and a Plattenbau usually differ significantly in price, even if the asking rents are close.
03Rents per district
The asking rents per district are taken from the FOG Institute's housing market sample, published by CHEMNITZ in ZAHLEN. They are available for the nine districts with more than 10,000 inhabitants. This is a private sample, not an official statistic.
There is a difference of only 73 cents between the highest and lowest values. Since 2015, asking rents have risen in all nine districts by €0.65 to €1.57, with the sharpest increases in Schloßchemnitz and Sonnenberg. The figures fluctuate from year to year, for example in the centre from €6.42 (2024) to €5.95 (2025).
For the ortsübliche Vergleichsmiete (local comparable rent), the Mietspiegel 2025 (2025 rent index) applies. According to the FOG Institute's data report, the basic rents for flats built up to 1990 are between €5.11 and €6.31/m², for the years 1991 to 2013 between €5.91 and €7.54/m², and from 2014 onwards between €8.33 and €11.19/m².
Enter the purchase price and the actual rent, and the calculator will show the gross and net rental yield.
04Population, households and vacancies
According to the registration office, 251,699 people were living in Chemnitz at the end of 2024, 1.1% more than at the end of 2015. At the end of 2025, the figure was 251,069, so slightly lower again. The growth in recent years was mainly due to migration, including from abroad, while more people died than were born.
This migration is concentrated in a few districts. The city centre has grown by 24.7% since 2015, Sonnenberg by 15.7%, Lutherviertel by 10.5% and Altchemnitz by 9.8%. Most other large districts lost between 1% and 5% of their inhabitants.
Where flats are occupied
For investors in Chemnitz, the occupancy rate is the most important figure. According to the census, on 15 May 2022 around 16,750 of 151,900 flats were vacant, which is 11.0%. The FOG Institute estimates the number of vacant flats in 2025 at around 14,000. The city does not publish figures for individual districts.
Nevertheless, our approximation shows the differences. If there are 90 or more households per 100 flats, the building is likely to be quite full. At 80 to 81, as in Sonnenberg, Hilbersdorf, Lutherviertel and Hutholz, a larger proportion is probably vacant or currently being refurbished. Before buying, always check the vacancy rate in the building itself and how long it took to find new tenants the last few times.
Regarding the social structure, we only quote official figures. The proportion of unemployed people among 15 to 64-year-olds was 7.6% across the city at the end of 2024, ranging from 1.4% in Adelsberg to 14.3% in Helbersdorf. The unemployment rate reported by the Employment Agency was 10.1% in September 2026. These figures describe the residents of a district, not the quality of an individual flat. For your letting, what counts is vetting the individual tenant.
05Five district types for property investors
Instead of a ranking, we assign the districts to five types. Each suits different types of investors.
Type 1: Sought-after Gründerzeit buildings in the west
Kaßberg, Schloßchemnitz and Altendorf have the highest asking rents in the city (€6.22 to €6.39/m²). In Kaßberg and Schloßchemnitz, more than half of the flats date from the period up to 1924. The occupancy rate, with 86 to 92 households per 100 flats, is above average.
- You are looking for refurbished period flats with stable demand.
- You check the building's refurbishment year, roof, pipes and maintenance fund.
- Good lettability is more important to you than the lowest price.
- You are expecting sharply rising rents.
- You buy an unrefurbished building with no maintenance fund.
Type 2: Zentrum and Bernsdorf
Zentrum is the fastest-growing district, while Bernsdorf is located by the TU campus on Reichenhainer Straße. Both have a mix of post-war buildings, Plattenbau and Gründerzeit buildings. Both have around 59% single-person households and an occupancy rate of 90 to 92.
- You want to let to students, young professionals and new residents.
- You can manage more frequent tenant turnover in small flats.
- You only want to let to long-term tenants.
- You do not check the year of construction and building type carefully.
Type 3: Gründerzeit buildings in the east
Sonnenberg, Lutherviertel and Hilbersdorf are old districts with many Gründerzeit buildings and a strong inflow of new residents since 2015. At the same time, the occupancy rate of 80 to 81 households per 100 flats is the lowest among the large districts, and Sonnenberg has the lowest asking rent of the nine large districts.
- You can buy at a very low entry price and are able to take on more risk.
- You inspect and compare the street and the building yourself.
- You budget for reserves for vacancies and refurbishment.
- You rely on continuous letting.
- You are a first-time buyer.
Type 4: Heckert area and large housing estates
Markersdorf, Helbersdorf, Hutholz, Morgenleite, Kappel and the Yorckgebiet consist predominantly of Plattenbau buildings from the years 1970 to 1990. At €5.68 to €5.78/m², the asking rents are barely below the city average, while the occupancy rate is between 80 and 87. The unemployment shares of 10.9% to 14.3% are higher than the city average.
- You have experience with Plattenbau condominiums and large owners' associations.
- You can check the management plan, maintenance fund and vacancy rate in the building.
- You mistake the low price for a guaranteed yield.
- You have no reserves for longer vacancies.
Type 5: Settlements and localities on the outskirts
Adelsberg, Grüna, Reichenbrand, Borna-Heinersdorf and the localities consist largely of one- and two-family houses. The households are larger, and the unemployment shares of 1.4% to 4.0% are the lowest. Condominiums are rare there, and the population is declining slightly.
- You want to let to families and older couples.
- You are looking for a single flat in a small building.
- You expect demand from students or new residents.
- You need a wide selection of flats quickly.
06Example calculation: the same flat in three districts
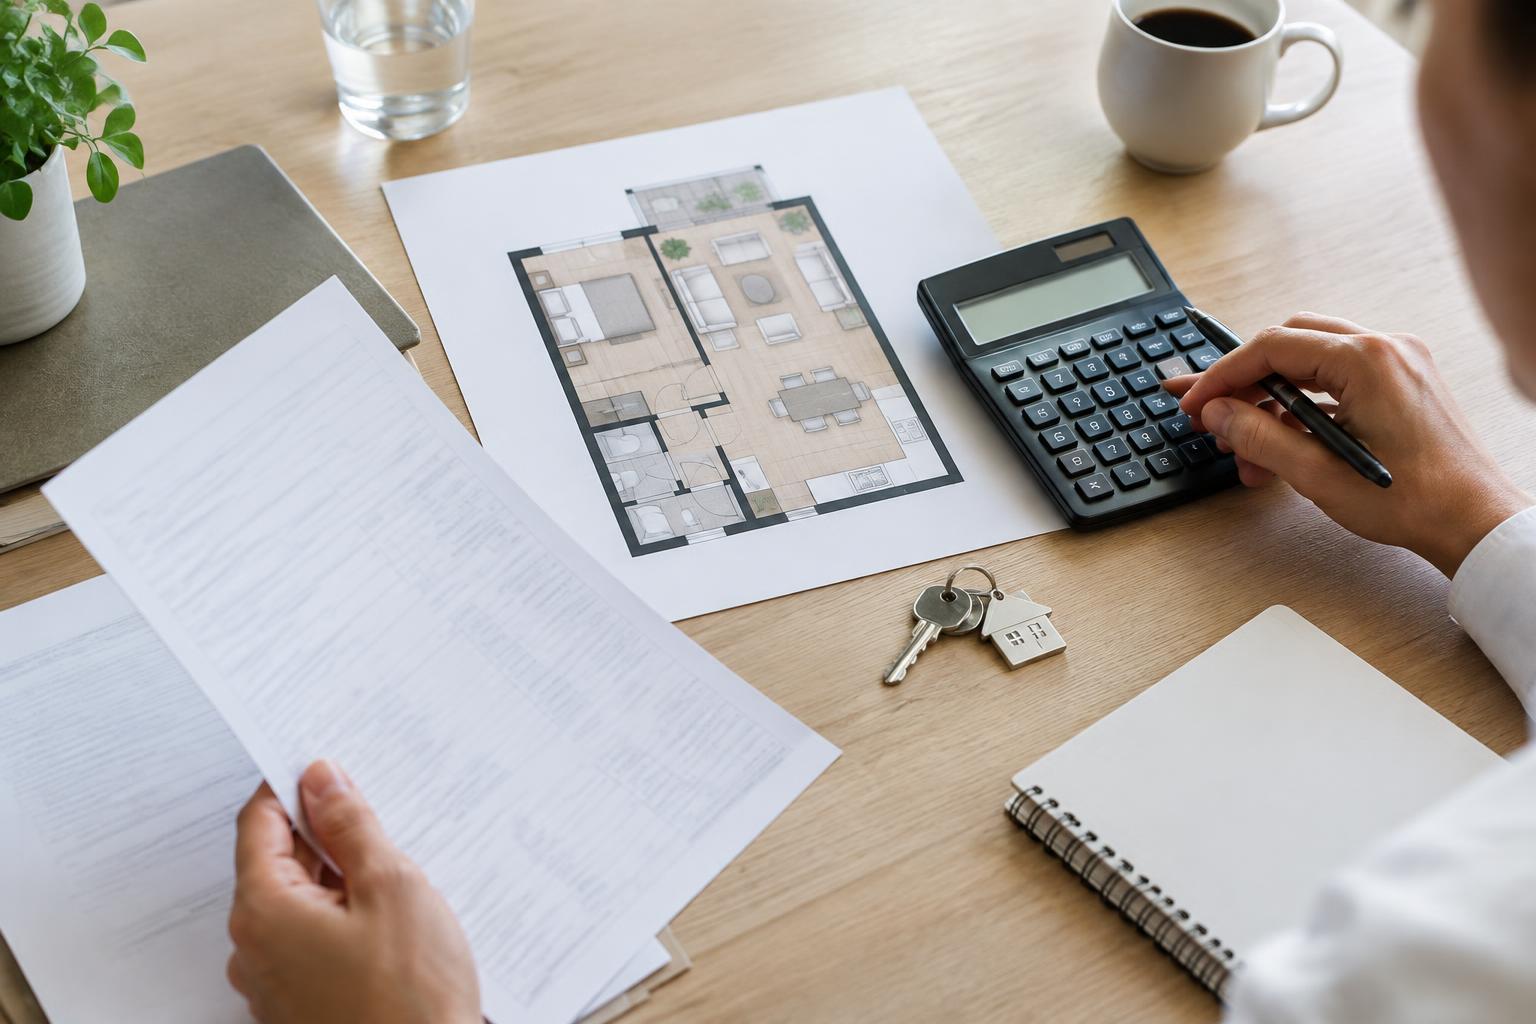
Let's take Lena. She is an employee, single, has a taxable income of €60,000 and buys a let two-room flat of 55 m². She compares three districts: a Gründerzeit building in Kaßberg, a Gründerzeit building in Sonnenberg and a Plattenbau in Markersdorf. The name is fictitious; the figures are an example calculation and not a forecast.
Because the valuation committee does not publish prices per district, we will use the city-wide average for resales in 2025 of around €1,160/m² in all three cases. This shows the impact of the rent alone. For the rent, we use the asking rent for the district from the 2025 FOG sample.
| Kaßberg | Sonnenberg | Markersdorf | |
|---|---|---|---|
| Purchase price per m² (city average 2025) | €1,160 | €1,160 | €1,160 |
| Purchase price 55 m² | €63,800 | €63,800 | €63,800 |
| Grunderwerbsteuer (property transfer tax) 5.5% | €3,509 | €3,509 | €3,509 |
| Notary and land register (approx. 1.8%) | €1,148 | €1,148 | €1,148 |
| Total costs | €68,457 | €68,457 | €68,457 |
| Net cold rent per m² (asking 2025) | €6.25 | €5.66 | €5.68 |
| Net cold rent per year | +€4,125 | +€3,736 | +€3,749 |
| Service charge, non-apportionable | −€924 | −€924 | −€924 |
| Interest (3.8%) | −€2,424 | −€2,424 | −€2,424 |
| Principal repayment (2%) | −€1,276 | −€1,276 | −€1,276 |
| Cash flow before tax | −€499 | −€889 | −€876 |
| Depreciation on 75% of total costs | €1,284 (2.5%) | €1,284 (2.5%) | €1,027 (2%) |
| Taxable result from letting | −€45 | −€434 | −€164 |
| Tax savings (2026 tariff) | +€18 | +€168 | +€64 |
| Cash flow after tax | −€481 | −€721 | −€812 |
| per month | approx. −€40 | approx. −€60 | approx. −€70 |
| Gross rental yield | 6.5% | 5.9% | 5.9% |
In all three districts, Lena pays an additional €40 to €70 per month, even though she repays €1,276 in principal each year. Without the principal repayment, there would be a surplus of €39 to €66 per month. At such low purchase prices, tax plays a minor role; the saving is between €18 and €168 per year.
In practice, the flat in Kaßberg would usually cost more than the city average, while the Plattenbau in Markersdorf would usually cost less. The higher rent in Kaßberg yields around €390 more per year. With a gross rental yield of around 6%, this justifies a premium of roughly €6,500, or just under €120/m².
A single three-month vacancy therefore costs Lena as much as just under two to over three years of her ongoing contribution. That is why, in Chemnitz, the question of how well a building is let is more important than a few cents of rent. You can read about how rental income is taxed in our guide Tax on rental income.
07Risks when choosing a district in Chemnitz
- Vacancies: 11.0% of flats were vacant in the 2022 census. In some districts, there are only around 80 households per 100 flats.
- No district-level prices: The valuation committee only publishes city-wide averages. Check the price of your flat against comparable sales.
- Falling prices: Resale prices have fallen by around 10% since 2022.
- Population: More deaths than births; growth depends on migration. The State Statistical Office expects the population to decline by 2045.
- Labour market: The unemployment rate was 10.1% in September 2026.
- Refurbishment backlog: In Gründerzeit districts with high vacancy rates, there are unrefurbished or partially refurbished buildings. Special levies can wipe out a decade's worth of returns.
- Interest rates: Even with gross yields of around 6%, more expensive follow-on financing can consume the surplus.
08Other locations
The figures for Chemnitz as a whole, the rules for landlords and a new-build calculation can be found on our page Buy-to-let properties in Chemnitz. Our Leipzig and Dresden district analyses compare the districts of the other two major cities in Saxony. Other cities are covered in the Saxony overview and the City Comparison 2026.
FAQFrequently asked questions
Which Chemnitz district is best for property investors?
There is no single 'best' district. Kaßberg, Schloßchemnitz and Altendorf have the highest asking rents and a good occupancy rate, while the Zentrum (city centre) is growing the fastest. The deciding factors in Chemnitz are whether the individual building is well let, the size of the maintenance reserve, and the condition of the building.
How much does a flat cost in Chemnitz?
According to the Upper Valuation Committee, resale flats cost an average of around €1,160/m² in 2025, while new-builds cost around €5,110/m². The Valuation Committee does not publish prices for individual districts.
How many districts does Chemnitz have?
Chemnitz has 39 districts, eight of which are localities with their own local council: Euba, Einsiedel, Klaffenbach, Kleinolbersdorf-Altenhain, Grüna, Mittelbach, Röhrsdorf and Wittgensdorf. The largest district is Kaßberg, with 18,617 residents (31 December 2024).
What is the rental yield in Chemnitz?
With an average price of around €1,160/m² and asking rents between €5.66 and €6.39/m², the gross rental yields are around 5.9% to 6.6%. After deducting Hausgeld (service charges), interest and potential vacancies, considerably less remains.
Is a flat in Kaßberg a worthwhile investment?
Kaßberg is the largest district, has one of the highest asking rents at €6.25/m², and an occupancy of 90 households per 100 flats. In our calculation, Lena has a monthly surplus of around €40 there, while making a principal repayment of €106. Whether it is worthwhile depends on the individual flat's purchase price, the rent as per the contract, and the condition of the building.
Is there a rent cap (Mietpreisbremse) in Chemnitz?
No. In Saxony, the Mietpreisbremse (rent cap) and reduced Kappungsgrenze (rent increase cap) only apply in Dresden and Leipzig. In Chemnitz, the statutory rent increase cap of 20% over three years applies, up to the local comparable rent as defined in the 2025 rent index (Mietspiegel).
Which districts in Chemnitz are growing?
Since 2015, the main growth has been in the Zentrum (city centre) (+24.7%), Sonnenberg (+15.7%), Lutherviertel (+10.5%) and Altchemnitz (+9.8%). In 2024, Lutherviertel, the Zentrum and Helbersdorf grew the most.
09Further reading
- Buy-to-let properties in Chemnitz: Figures and locations
- A condominium as a buy-to-let investment: Pros and cons
- Tax on rental income
- Rental yield calculator
- Property acquisition cost calculator
- Property transfer tax in Saxony
10Sources
All sources accessed on 16 October 2026.
- City of Chemnitz, Department of Statistics, Elections: Statistical Information "Stadtteile 2024" (editorial deadline 15 October 2025): Population by year, households, unemployed persons on 31 December 2024, residential buildings and flats by construction year classes on 31 December 2023
- CHEMNITZ in ZAHLEN (FOG Institute): Asking rents per district 2008–2025 and Data Report Housing Market Chemnitz 2026 (Rent Index 2025, vacancies, ancillary costs)
- Upper Valuation Committee for Property Values in the Free State of Saxony, Schlaglicht Markt 2026 Chemnitz – Dresden – Leipzig (reporting year 2025), via CHEMNITZ in ZAHLEN, Purchase Prices; Market Information
- Census 2022 (reference date 15 May 2022), Vacancies Chemnitz, via wahlatlas.net
- Freie Presse: Chemnitz unemployment remains above ten per cent (September 2026, figures from the Chemnitz Employment Agency)
- State Statistical Office of Saxony, 9th Regionalised Population Forecast, Chemnitz Planning Region
- Saxon Rent Control Ordinance and Saxon Rent Increase Cap Ordinance (Dresden and Leipzig only)
- § 32a EStG (Income Tax Act, 2026 tariff), § 7 EStG (depreciation), § 558 BGB (Civil Code, rent increase cap)
- Households per 100 flats, shares by year of construction, purchase prices read from chart, gross rental yields and example calculation: own calculation, as of 16 October 2026
Disclaimer: This page provides general information and does not constitute investment, tax or legal advice. All figures are provided with their source and date; the example calculation is based on disclosed assumptions and is not a forecast. As of 16 October 2026.
Writes about Taxes, AfA (depreciation), Existing properties and Portfolio building.
Since 2020, Eduard has bought seven properties of his own and supported more than 150 clients. He writes about tax levers, property documents and portfolio building – with honest numbers instead of rosy projections.
This guide does not replace tax or legal advice. All figures are example calculations with disclosed assumptions.