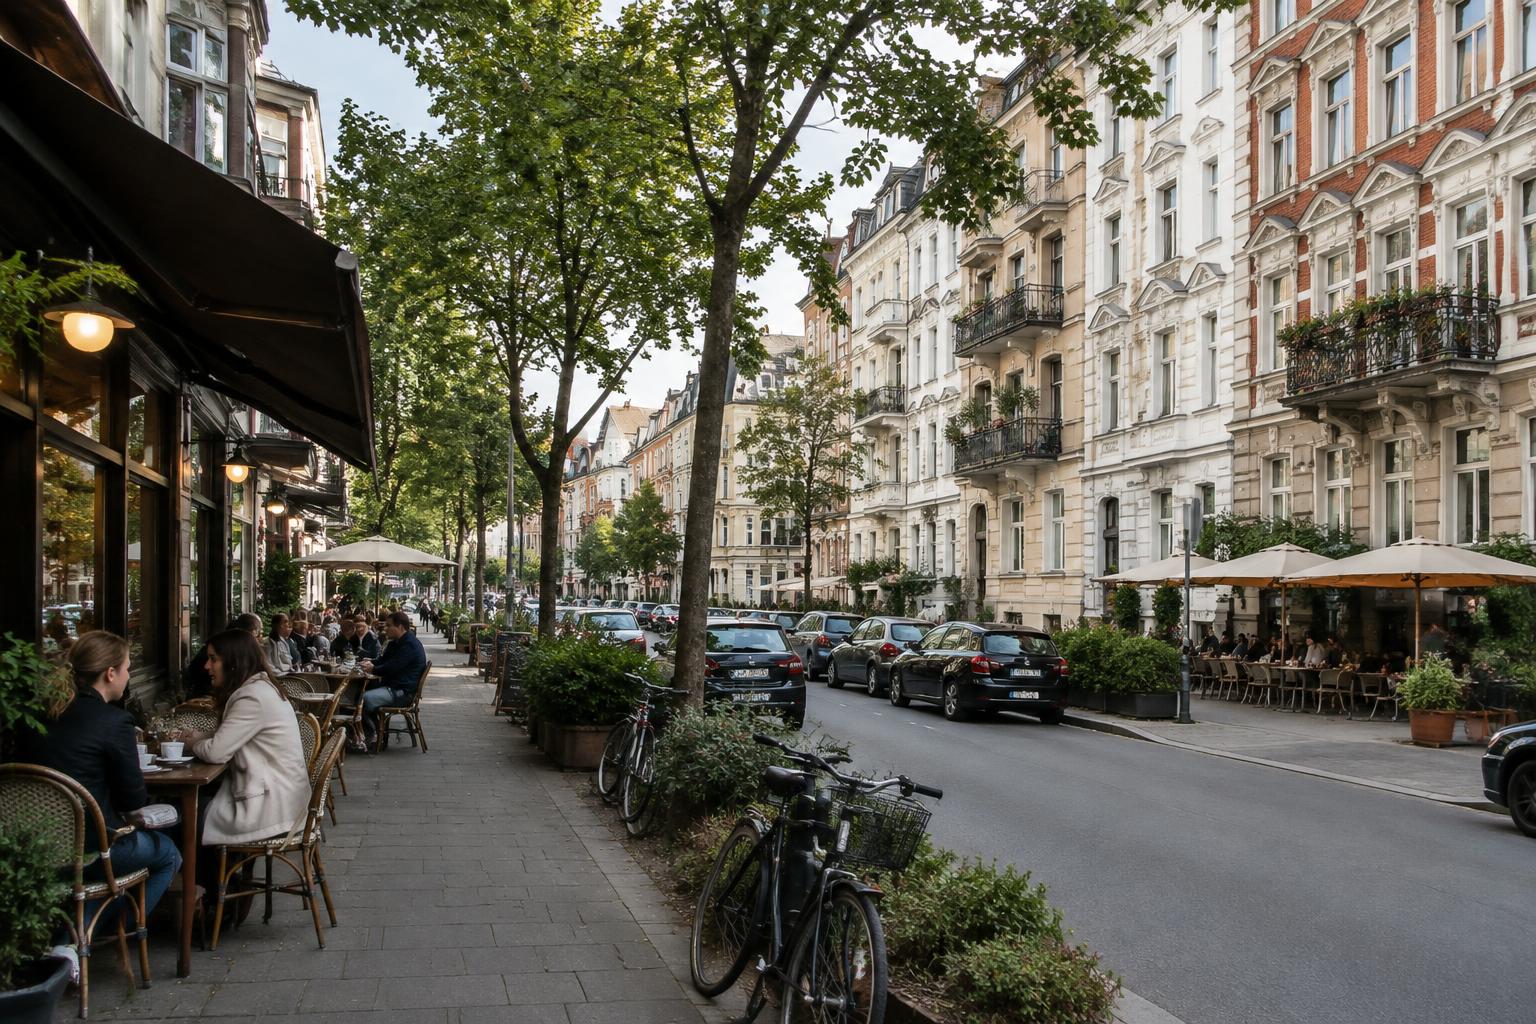
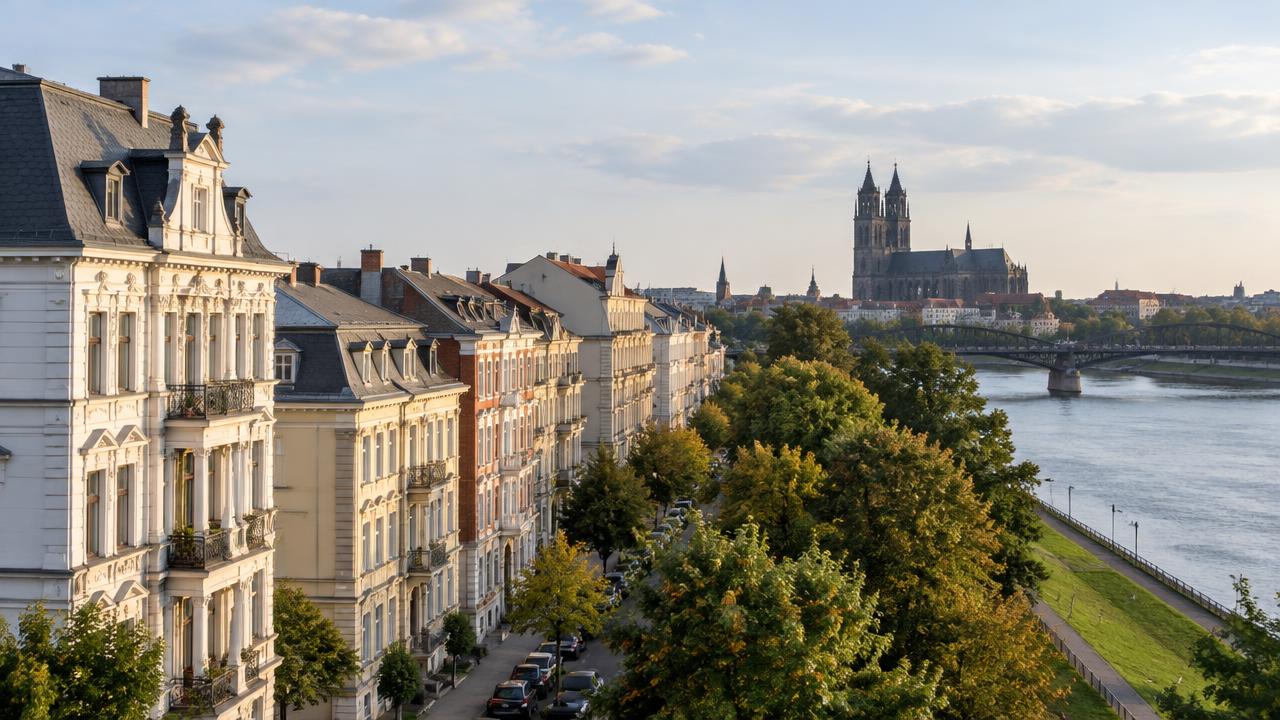
Essen for Property Investors: All 9 Districts Compared in 2026
The gap between northern Essen and the south along the Ruhr is around €960 per square metre. Essen has no rent brake. We compare all nine districts using official figures and calculate the returns for the same flat in three districts.
 Kevin Celentano
Investment Advisor at InvestImmo
You have decided on Essen. Now comes a question that matters more here than elsewhere: south or north, Rüttenscheid or Altenessen, Kettwig or Steele? The city is visibly divided along the A 40 motorway. Flats are more expensive to the south and cheaper to the north.
For investors, Essen is something of an exception among the major cities of the Rhineland and Ruhr region. There is no rent brake. When letting a property to a new tenant, you are therefore not restricted to the local comparative rent plus 10%. That changes the calculation, but it does not change the need for the location, building and tenant to be a good match.
Here, we compare all nine boroughs using official figures from the city and the Gutachterausschuss. There is no ranking, nor any judgement of the people who live there. At the end, we run the numbers for the same flat in three boroughs, before and after tax.
01Essen’s nine boroughs: the comprehensive comparison table
The table summarises the key official indicators for each borough. Population, household and dwelling figures come from the Amt für Statistik, projections and vacancy rates from the Essen Housing Market Report, and purchase prices from the Gutachterausschuss’s property reference values.
| Borough | Population June 2026 | Projection 2023–2035 | Single-person households | Dwellings | Vacancy rate 2023 (electricity meters) | Subsidised rental dwellings | Average flat reference value |
|---|---|---|---|---|---|---|---|
| I Stadtmitte/Frillendorf/Huttrop | 69,508 | +10% | 58.4% | 39,924 | 6.4% | 5.0% | €2,456/m² |
| II Rüttenscheid/Bergerhausen | 54,878 | −2% | 54.4% | 34,139 | 5.4% | 1.9% | €2,699/m² |
| III Essen-West | 98,989 | +3% | 56.8% | 57,798 | 5.9% | 2.6% | €2,443/m² |
| IV Borbeck | 83,184 | −3% | 47.2% | 46,156 | 4.9% | 6.4% | €2,143/m² |
| V Altenessen/Karnap/Vogelheim | 58,210 | +2% | 46.1% | 29,939 | 6.3% | 10.6% | €1,953/m² |
| VI Zollverein | 52,239 | +1% | 40.7% | 25,643 | 4.9% | 10.9% | €1,942/m² |
| VII Steele/Kray | 71,067 | −1% | 45.4% | 36,821 | 5.0% | 8.7% | €2,075/m² |
| VIII Ruhrhalbinsel | 51,243 | −6% | 41.8% | 27,797 | 3.9% | 4.6% | €2,523/m² |
| IX Werden/Kettwig/Bredeney | 51,020 | −5% | 46.0% | 28,754 | 4.6% | 0.8% | €2,905/m² |
| Essen | 590,338 | – | 49.7% | 326,971 | 5.3% | 5.5% | €2,425/m² |
Residents with their main residence in Essen as at 30 June 2026, households as at 30 June 2026, dwellings as at 31 December 2025 (provisional). City projection under the main scenario, excluding planned new housing developments. Vacancy rate measured using the electricity-meter method as at 31 December 2023; this also includes deliberate vacancies and vacancies due to building work. Subsidised rental dwellings as at 1 January 2023. Reference values: simple average across property reference value zones for existing individually owned flats as at 1 January 2026, based on a standard property built in 1962 with 69 m² of floor area; own analysis.
Two patterns stand out. The southern boroughs along the Ruhr (II, VIII, IX) are the most expensive, while the northern boroughs (V, VI) are the cheapest, with a gap of around €960 per square metre. And the city centre and adjoining areas in boroughs I and III are the market for people living alone: more than one in two households there consists of one person, and the city expects growth here by 2035.
02Purchase prices by borough: what the reference values show
Each year, the Gutachterausschuss derives property reference values from notarised purchase contracts. Essen has 453 reference value zones for individually owned flats. All relate to the same standard flat: built in 1962, with 69 m² of living space. This allows direct comparisons between zones. For the boroughs, we have averaged the values across all zones.
Values vary within the boroughs. In Borough III, Holsterhausen (€2,807/m²) and Altendorf (€2,089/m²) are around €700 apart; in Borough I, Südviertel (€2,894/m²) and Frillendorf (€2,012/m²) also differ. The highest neighbourhood values are in Bredeney (€3,242/m²) and Heisingen (€3,000/m²), and the lowest in Vogelheim (€1,900/m²), Karnap (€1,907/m²) and Katernberg (€1,919/m²).
The Gutachterausschuss itself states how strongly location determines price. It provides adjustment coefficients for comparing flats: a flat in a basic location is worth around 25% less than one in an average location, while one in a good location is worth 20% more and one in a very good location 35% more. The value in a very good location is therefore almost twice that in a basic location.
A reference value is not a price for your flat. It describes a standard flat within the zone. The year of construction, size, condition, floor and specification alter the value, often significantly. Small flats generally cost more per square metre than the standard 69 m² flat.
03Rents: what the evidence shows and which rules apply without a rent brake
Stadt Essen does not publish rents by borough. What is documented is the actual rental income generated by tenanted individually owned flats. In 2025, the Gutachterausschuss analysed 173 sales of tenanted flats: rent averaged €7.41/m², with a range from €6.29 to €11.03/m². The average purchase price was €2,174/m², averaging 24.2 times the annual rent.
Newly advertised flats command higher rents. According to NRW.BANK, the median asking rent for re-let properties in 2024 was €8.77/m². This is a city-wide figure based on listings, not an agreed rent.
For investors, this means that in sought-after locations, a change of tenant offers more scope to achieve a market rent than in Köln or Dortmund. Whether the market will support it depends on the flat’s location and condition. You should therefore base your calculations on the rent in the current agreement, not on hopes for the next tenant.
Enter the purchase price and actual rent, and the calculator will show the gross and net rental yields.
04Population, households and vacancy rates by district
For landlords, what matters is who lives in a district and how they live. The figures reveal two very different patterns of demand.
In Districts I and III, covering the city centre and the west, including Holsterhausen and Frohnhausen, 57 to 58% of households consist of people living alone. These areas are home to the Universitätsklinikum and the campus, and have the most small flats. The city expects the population of District I to grow by around 10% by 2035, and that of Essen-West by 3%.
The situation is different in the south. Districts VIII and IX have fewer people living alone and an older population; projections anticipate 5 to 6% fewer residents here by 2035. New housing developments are not yet included in these figures.
Families are most prevalent in the north. In the Zollverein district, only 40.7% of households are single-person households, and the average household size is 2.2 people. Districts V and VI are expected to grow slightly.
We cite only official figures on the social structure. At the beginning of 2023, the proportion of publicly subsidised rental flats ranged from 0.8% in District IX to 10.9% in the Zollverein district. In September 2022, District V had the highest proportion of unemployed people among those aged 18 to 64, at 12.1%, while Districts IX (3.4%) and II (3.6%) had the lowest. This describes differences in the tenant population, not the quality of the districts. For your letting, what matters is the individual household you assess during tenant selection.
05Four district types for property investors
Rather than ranking the nine districts, we group them into four types. Each type suits different investors.
Type 1: the south along the Ruhr
Werden, Kettwig, Bredeney, Rüttenscheid, Bergerhausen and the Ruhrhalbinsel have the highest benchmark values in the city, ranging from around €2,500 to €2,900/m². The proportion of subsidised flats is low, as is unemployment. Rüttenscheid, with its nightlife district, is a distinct, densely built-up market, while the Ruhrhalbinsel is more of an area for families and owner-occupiers.
- You value a stable tenant base with strong financial means.
- You plan to hold for the long term and can cover a monthly shortfall.
- You are looking for small flats in Rüttenscheid or Bergerhausen.
- You are counting on population growth in the district.
- You expect a high ongoing yield.
Type 2: the city centre and Essen-West
Districts I and III average around €2,450/m², with substantial differences between Südviertel and Holsterhausen on the one hand and Altendorf or Frillendorf on the other. These areas have the most people living alone, students and Universitätsklinikum employees. The city expects the strongest growth here.
- You want to let small flats to people living alone.
- You compare individual neighbourhoods within the district.
- You allow for more frequent tenant turnover.
- You base your calculations on the district average rather than the zone’s benchmark value.
- You are looking for a quiet residential setting for families.
Type 3: Borbeck and Steele/Kray
At around €2,080 to €2,140/m², Districts IV and VII are below the city average. Borbeck-Mitte and Steele have their own neighbourhood centres with S-Bahn connections. The tenant base is mixed, and the proportion of subsidised flats, at 6 to 9%, is above the city average. Projections anticipate slight population declines here.
- You are looking for a mid-range entry price.
- You prefer flats close to neighbourhood centres.
- You carefully check the service charges and reserve fund.
- You want to buy without a viewing or supporting documents.
- You are counting on a rising population in the district.
Type 4: the north of Essen
Altenessen, Karnap, Vogelheim, Katernberg, Stoppenberg and Schonnebeck have the lowest benchmark values in the city, at around €1,940 to €1,950/m². This is home to the Zollverein World Heritage Site and many families, and the proportion of subsidised flats is the highest, at over 10%. A low purchase price does not automatically mean less risk or a higher return: letting may require more work, and tenant turnover may be higher.
- You have experience in letting and property management.
- You know the building, the owners’ association and the street well.
- You want to let larger flats to families.
- You are buying a flat for the first time.
- You equate a low price with a good yield.
06Worked example: the same flat in three districts
Take Sven. He is employed, single and has a taxable income of €60,000. He buys a tenanted two-room flat measuring 55 m², built in the 1960s, and compares three districts: Rüttenscheid/Bergerhausen, Essen-West and Zollverein. The name is fictional, and the figures are a worked example, not a forecast.
For the purchase price, we use the average benchmark value in each district. For rent, we assume €7.41/m² in all three districts, the average rent for tenanted flats according to the Gutachterausschuss. District-level rental figures are not available. Rents may be higher in sought-after locations and lower in the north. We deliberately use the same figure to make the difference in purchase prices clear.
| Rüttenscheid/Bergerhausen | Essen-West | Zollverein | |
|---|---|---|---|
| Purchase price per m² (average benchmark value) | €2,699 | €2,443 | €1,942 |
| Purchase price for 55 m² | €148,445 | €134,365 | €106,810 |
| Property transfer tax 6.5% | €9,649 | €8,734 | €6,943 |
| Notary and land registry (around 1.8%) | €2,672 | €2,419 | €1,923 |
| Total costs | €160,766 | €145,518 | €115,676 |
| Rent excluding service charges per m² | €7.41 | €7.41 | €7.41 |
| Annual rent excluding service charges | +€4,891 | +€4,891 | +€4,891 |
| Service charges not recoverable from tenants | −€924 | −€924 | −€924 |
| Interest (3.8%) | −€5,641 | −€5,106 | −€4,059 |
| Principal repayment (2%) | −€2,969 | −€2,687 | −€2,136 |
| Cash flow before tax | −€4,643 | −€3,826 | −€2,228 |
| Depreciation at 2% on 75% of total costs | €2,411 | €2,183 | €1,735 |
| Taxable rental result | −€3,623 | −€2,860 | −€1,365 |
| Tax saving (2026 tax schedule) | +€1,375 | +€1,089 | +€524 |
| Cash flow after tax | −€3,268 | −€2,737 | −€1,704 |
| Per month | around −€270 | around −€230 | around −€140 |
| Gross rental yield | 3.3% | 3.6% | 4.6% |
Sven contributes money every month in all three districts. In Rüttenscheid/Bergerhausen, this amounts to around €270 after tax, of which €247 is principal repayment that reduces his outstanding debt. In Zollverein, it is around €140, with €178 in principal repayment. Excluding principal repayment, he would be slightly in positive territory there.
With the same rent, the purchase price alone determines the outcome. The flat in the south costs around 40% more than the one in the north, but generates not a single euro more in rent in this calculation. Buyers in the south are paying for more stable demand and the location. Whether they can also achieve a higher rent there depends on the individual flat.
The calculation is not a recommendation for any district. In the north, the monthly shortfall is smaller, but you take on greater letting risk and need to scrutinise the building and tenants more closely. The guide to tax on rental income shows how much you could save in tax at your income level.

07Risks When Choosing a District in Essen
Each district has its own risks. Some apply to all of them.
- Averages rather than individual cases: Reference values apply to a standard flat built in 1962. Within a district, values across zones differ by up to €1,000/m².
- Fewer residents in the south: The city expects population declines in five of its nine districts by 2035, with a 6% decline on the Ruhrhalbinsel. Fewer households mean more competition for tenants.
- Older housing stock: More than half of Essen’s homes date from 1949 to 1978. Windows, pipework, roofs and heating systems are due for replacement in many properties, affecting maintenance reserves and service charges.
- Vacancy: At 3.94%, the vacancy rate in the 2022 Census was higher than in Köln (2.5%), for example. In less desirable locations, finding a new tenant can take longer.
- Interest rates: With gross yields between 3.3% and 4.6%, every percentage-point change in interest rates has a substantial impact on the figures.
- Labour market: The unemployment rate stood at 11.3% in September 2026. Missed rent payments are more likely in districts with many households receiving welfare benefits, but are not confined to them.
- Rules can change: Essen currently has no rent brake limiting rents on new lettings. The state can extend the geographical scope of its Tenant Protection Ordinance.
08Other Locations
You can find figures for Essen as a whole, the rules for landlords and a new-build investment calculation on our page Investment Properties in Essen. We compare the districts of the neighbouring city in Dortmund for Property Investors: All 12 Districts Compared. Further cities in North Rhine-Westphalia are covered in the North Rhine-Westphalia overview, and all cities in the 2026 City Comparison.
FAQFrequently asked questions
Which Essen district is best for property investors?
There is no single best district. The south has the most stable tenant base, but also the highest prices and a shrinking population. In the north, entry prices are lower, but letting often requires more effort. Your budget, holding period and the individual flat are what matter.
Where are flats cheapest in Essen?
The districts with the lowest benchmark property values for existing flats are Zollverein (average €1,942/m²) and Altenessen/Karnap/Vogelheim (average €1,953/m²), based on a standard flat built in 1962. The most expensive district is Werden/Kettwig/Bredeney, at an average of €2,905/m².
How many districts and neighbourhoods does Essen have?
Essen has nine districts comprising 50 neighbourhoods. The districts are numbered with Roman numerals from I (Stadtmitte, Frillendorf, Huttrop) to IX (Werden, Kettwig, Bredeney).
Does Essen have a rent brake?
No. Essen is not included in the North Rhine-Westphalia Tenant Protection Ordinance (Mieterschutzverordnung NRW). For new lettings, only the limit on excessive rents applies; during an existing tenancy, rent increases are capped at 20% over three years.
How high are rental yields in Essen’s districts?
In our example calculation, using the same rent of €7.41/m², the gross rental yield ranges from 3.3% in Rüttenscheid/Bergerhausen to 4.6% in Zollverein. The property valuation committee reports an average purchase price of 24.2 times the annual rent for tenanted flats, equivalent to a yield of just over 4%.
Is a flat in northern Essen a worthwhile investment?
Entry prices there are significantly lower, and in our calculation the flat requires the smallest cash top-up. However, the proportion of subsidised housing and unemployment are higher, and the vacancy rate in district V is above the city average. Whether it is suitable depends on the building, the tenancy agreement and your experience as a landlord.
Where is Essen growing?
The city expects the strongest growth by 2035 in district I, at around 10%, alongside slight increases in Essen-West and the north (districts V and VI). In the south, it forecasts declines of 2–6%.
09Further Reading
- Investment Properties in Essen: Figures and Locations
- A Flat as an Investment: Advantages and Disadvantages
- Tax on Rental Income
- Rental Yield Calculator
- Property Purchase Costs Calculator
- Property Transfer Tax in North Rhine-Westphalia
10Sources
All sources accessed on 14 October 2026.
- Gutachterausschuss für Grundstückswerte in der Stadt Essen, property reference values for owner-occupied flats as at 1 January 2026, published in BORIS-NRW and as Open Data Property Reference Values for North Rhine-Westphalia (data as at 14 October 2026)
- Gutachterausschuss für Grundstückswerte in der Stadt Essen, 2026 Property Market Report, Tables 6.3 and 6.4
- Stadt Essen, Amt für Statistik, Stadtforschung und Wahlen: Population in the City Districts and Neighbourhoods as at 30 June 2026, A Look at … People in Essen 08/2026 (Private Households J 2.1), A Look at … Housing in Essen 05/2026 (Housing Stock B 1)
- Stadt Essen, Sixth Essen Housing Market Report 2024: vacancy by city district (Fig. 6), subsidised rental homes (Fig. 25), proportion unemployed (p. 59), population projections by city district (Fig. 65)
- NRW.BANK, Essen Housing Market Profile 2025 (asking rents for re-lettings in 2024)
- Agentur für Arbeit Essen, The Labour Market in September, 30 September 2026
- North Rhine-Westphalia Tenant Protection Ordinance (MietSchVO NRW) (list of municipalities excluding Essen)
- Section 32a of the Income Tax Act (EStG) (2026 tax rates), Section 7 of the Income Tax Act (EStG) (depreciation), Section 558 of the German Civil Code (BGB) (cap on rent increases), Section 5 of the Economic Offences Act (WiStG) (excessive rents)
- District averages of reference values, gross rental yields and illustrative calculation: own calculations, as at 14 October 2026
Disclaimer: This page provides general information and does not constitute investment, tax or legal advice. All figures are accompanied by their source and reference date; the illustrative calculation is based on disclosed assumptions and is not a forecast. Last updated: 14 October 2026.
Writes about Purchase process, Notary and land registry and Letting.
Kevin combines twelve years of sales experience with nine years specialising in property and more than 500 consultations. He writes about property quality, location risks and a safe path from the first comparison to completion.
This guide does not replace tax or legal advice. All figures are example calculations with disclosed assumptions.