Kiel for Property Investors: All 30 Districts Compared 2026
The price difference between a resale flat in Mettenhof and one in Blücherplatz is almost €1,900 per square metre. The Mietspiegel (rent index) adjusts for location quality by minus 12% to plus 16%, and there is no Mietpreisbremse (rent cap). We compare the 30 districts using official data and run the numbers for the same flat in three different locations.
 Eduard Winter
Investment Advisor at InvestImmo
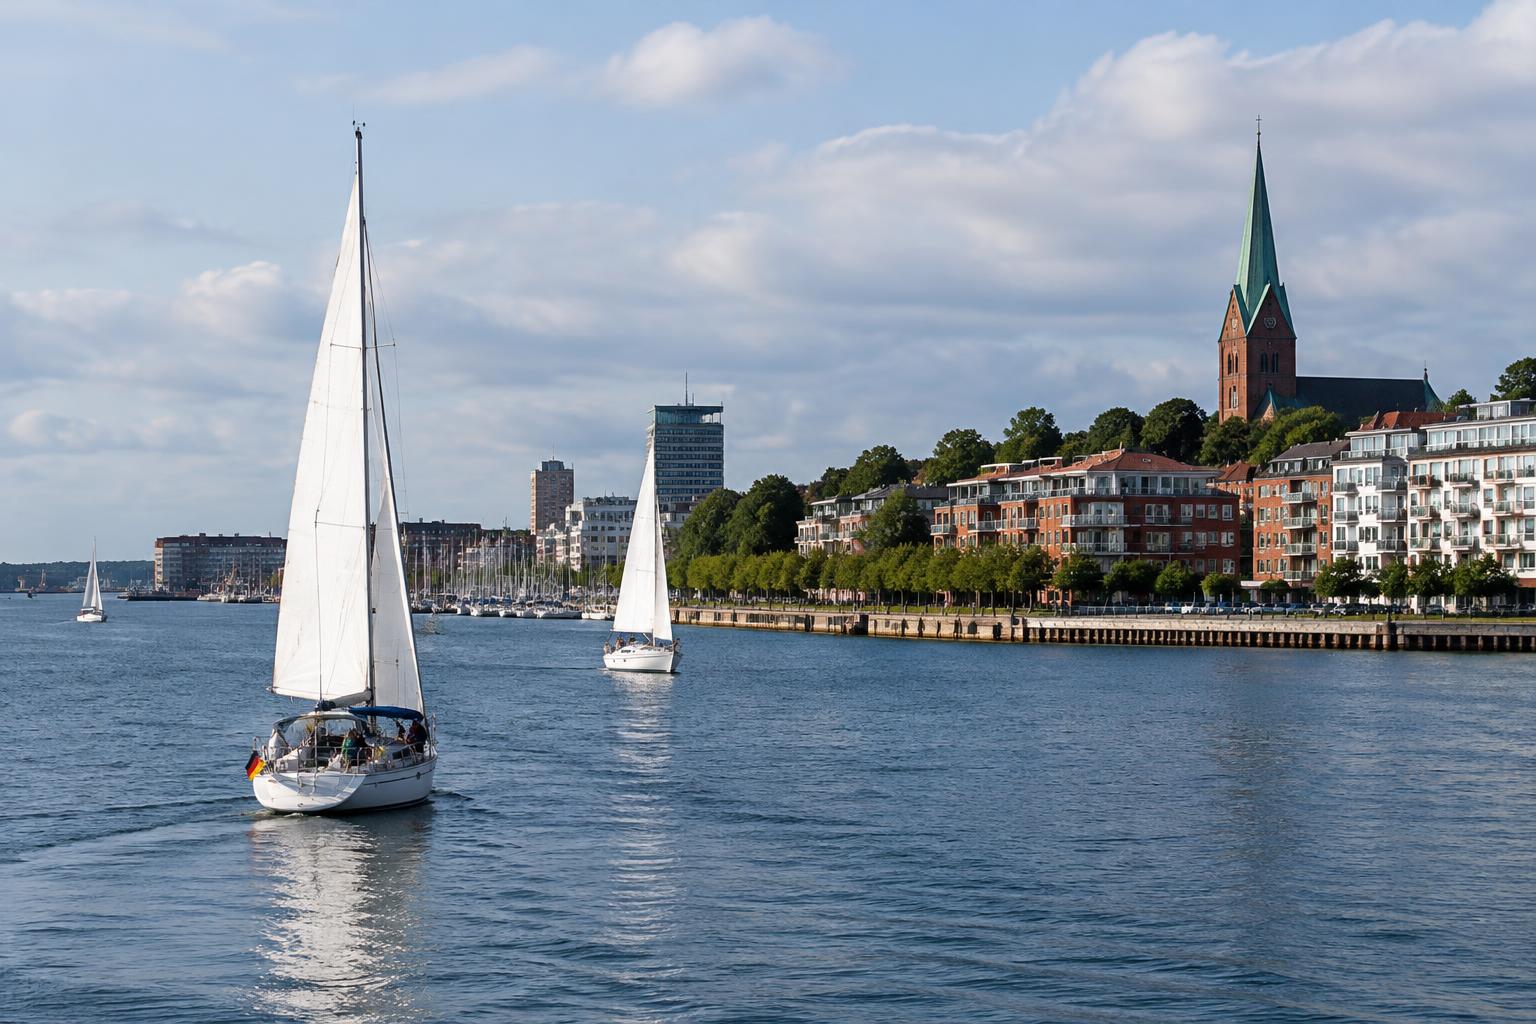
You have decided on Kiel. The next question is where: Ravensberg or Wik, Gaarden or Elmschenhagen, Mettenhof or Holtenau? Kiel has 30 districts, and the Förde divides them. The west bank is home to the city centre, the university, the university hospital and the late 19th-century districts. The east bank contains the former shipyard workers' districts and areas with a lot of post-war construction.
For landlords, a second point is important. There is no Mietpreisbremse (rent brake) in Kiel; Schleswig-Holstein abolished it in 2019. For existing tenancies, however, a Kappungsgrenze (rent increase cap) of 15% applies, and the Mietspiegel 2025 (rent index) distinguishes between four residential location categories: from minus 12% for a basic location to plus 16% for a very good one.
We compare all 30 districts using official figures from the city and the Gutachterausschuss (Valuation Committee). This is not a ranking, nor is it a judgement on the people who live there. At the end, we calculate the costs for the same flat in three different locations, before and after tax.
01Kiel in 30 districts: the big comparison table
The table summarises the most important official key figures for each district. The data for residents, households and unemployed people is taken from the City of Kiel's open data, as of the end of 2023. The purchase prices are the average prices of resold flats in 2025, according to the Valuation Committee.
| District | Residents 2023 | Change since 2015 | Single-person households | 18 to 29 years old | 65 years and older | Unemployed | Avg. purchase price 2025 (cases) |
|---|---|---|---|---|---|---|---|
| Altstadt | 1,220 | +83.5% | 66.4% | 27.9% | 24.0% | 1.8% | €4,900/m² (5) |
| Vorstadt | 1,648 | +26.3% | 66.5% | 31.4% | 17.6% | 3.5% | €4,500/m² (4) |
| Exerzierplatz | 6,299 | −1.5% | 72.1% | 30.6% | 16.9% | 10.6% | €3,600/m² (27) |
| Damperhof | 3,436 | +3.2% | 73.4% | 30.8% | 17.3% | 4.6% | €3,850/m² (14) |
| Brunswik | 6,473 | −0.2% | 73.6% | 33.4% | 17.4% | 2.9% | €3,800/m² (27) |
| Düsternbrook | 3,108 | −2.6% | 57.9% | 19.3% | 24.6% | 2.6% | €5,750/m² (6) |
| Blücherplatz | 11,234 | −0.1% | 62.9% | 22.2% | 16.0% | 2.0% | €4,000/m² (46) |
| Wik | 20,145 | +4.3% | 60.3% | 21.7% | 18.6% | 4.7% | €3,150/m² (62) |
| Ravensberg | 12,283 | +0.3% | 75.4% | 37.3% | 11.3% | 2.6% | €3,850/m² (51) |
| Schreventeich | 11,692 | −1.7% | 69.2% | 32.9% | 14.3% | 3.3% | €3,250/m² (41) |
| Südfriedhof | 15,404 | +2.0% | 71.6% | 31.5% | 14.0% | 4.7% | €2,750/m² (66) |
| Gaarden-Ost | 19,229 | +5.0% | 62.0% | 21.0% | 12.2% | 13.8% | €2,200/m² (32) |
| Gaarden-Süd/Kronsburg | 10,843 | +2.4% | 55.4% | 15.3% | 21.1% | 7.4% | €2,600/m² (12) |
| Hassee | 12,876 | +4.4% | 61.0% | 19.3% | 18.7% | 6.0% | €2,950/m² (42) |
| Hasseldieksdamm | 2,746 | −3.2% | 47.1% | 11.8% | 24.7% | 3.3% | – |
| Ellerbek | 6,180 | +2.9% | 55.6% | 16.2% | 21.7% | 7.7% | €2,150/m² (28) |
| Wellingdorf | 8,051 | +0.5% | 56.2% | 16.2% | 23.7% | 7.4% | €2,500/m² (12) |
| Holtenau | 6,206 | +3.5% | 51.1% | 14.1% | 24.0% | 8.2% | €3,550/m² (21) |
| Pries | 7,350 | −1.3% | 49.2% | 12.1% | 23.0% | 5.7% | €2,700/m² (11) |
| Friedrichsort | 2,103 | +0.4% | 59.4% | 13.2% | 22.3% | 6.1% | €2,500/m² (6) |
| Neumühlen-Dietrichsdorf | 12,845 | +5.5% | 55.7% | 18.9% | 19.3% | 7.8% | €3,050/m² (27) |
| Elmschenhagen | 17,164 | −0.2% | 47.1% | 12.9% | 22.5% | 6.2% | €2,350/m² (33) |
| Suchsdorf | 9,115 | −3.4% | 42.0% | 10.8% | 26.0% | 2.3% | €2,900/m² (27) |
| Schilksee | 4,857 | −2.5% | 50.1% | 6.2% | 45.2% | 3.1% | €3,100/m² (66) |
| Mettenhof | 19,940 | +1.1% | 40.1% | 13.7% | 18.8% | 10.9% | €2,100/m² (69) |
| Russee | 6,933 | −1.8% | 37.7% | 9.1% | 27.1% | 2.9% | €3,100/m² (12) |
| Meimersdorf | 3,219 | −2.1% | 25.4% | 9.3% | 12.2% | 2.3% | – |
| Moorsee | 2,190 | +10.6% | 29.6% | 9.8% | 15.9% | 2.3% | – |
| Wellsee | 5,219 | +0.2% | 41.8% | 12.0% | 17.7% | 5.0% | €2,650/m² (20) |
| Rönne | 404 | −5.6% | 38.2% | 6.9% | 28.0% | 4.3% | – |
| Kiel | 250,412 | +1.7% | 58.4% | 20.0% | 19.1% | 6.1% | – |
Residents as at 31 December 2023, change compared to 31 December 2015, age groups as a percentage of all residents in the district. Unemployed as at 31 December 2023 as a percentage of residents aged 15 to 64, own calculation, not comparable with the rate from the Federal Employment Agency. Purchase prices: Average of analysable resales of freehold flats in 2025 per m² of living space, all construction years, number of sales in brackets; “–” = no value published.
Two things stand out. In Ravensberg, Brunswik, Damperhof and Exerzierplatz, around the university and the city centre, almost three out of four households are single-person households, and around one in three residents is between 18 and 29 years old. And the districts with the most residents are not the city centre ones, but Wik, Mettenhof and Gaarden-Ost, each with around 20,000 people.
02Purchase prices by district
Each year, the Valuation Committee analyses the notarised purchase agreements and publishes average prices for existing freehold flats for each district. Unlike a guide price, this is a mean value of actual sales: the construction year, size and condition of the flats sold are all mixed together.
The range follows the Förde. To the west of the city centre, in Blücherplatz, Ravensberg, Brunswik and Damperhof, prices were around €3,800 to €4,000/m². On the east bank, in Gaarden-Ost and Ellerbek, they were around €2,200/m², as was the case in Mettenhof in the west. Düsternbrook on the Förde is the highest at €5,750/m², but this is based on only six sales of large flats with an average size of 130 m².
Pay attention to the construction year: in Blücherplatz and Schreventeich, the flats sold were on average from the 1930s; in Mettenhof and Elmschenhagen, from around 1970; and in Neumühlen-Dietrichsdorf and Russee, from around 1990. City-wide, prices have risen slightly again after the decline in 2023, but the Valuation Committee's index in 2025 was still around 11% below the 2022 peak.
03Rents: residential location categories in the rent index
Kiel has a qualifizierter Mietspiegel (qualified rent index), valid from 1 April 2025; the reference date for the data collection was 1 October 2024. The base rent depends on the living space: €9.98/m² for a 30 m² flat, €8.36/m² for 45 m², and €8.10/m² for 55 m². On top of this come surcharges and discounts for construction year, modernisation, fittings and residential location category.
| Feature in the 2025 rent index | Surcharge or discount |
|---|---|
| Residential location very good | +16% |
| Residential location good | +5% |
| Residential location normal | ±0% |
| Residential location basic | −12% |
| Year of construction 1919 to 1948 | −8% |
| Year of construction 1961 to 1977 | −9% |
| Year of construction 1995 to 2009 | ±0% |
| Year of construction 2020 to 2024 | +51% |
State Capital Kiel, Kiel Rent Index 2025, Tables 3 and 7. The surcharges and discounts are added together and applied to the base rent from Table 2.
The applicable residential location category is listed in the rent index's street directory, sometimes separated by house number. Examples of very good locations include Goethestraße and parts of Esmarchstraße; good locations include Holtenauer Straße between house numbers 16 and 234 and Feldstraße between 143 and 177. Basic locations include Skandinaviendamm and Göteborgring in Mettenhof, and Iltisstraße and Vinetaplatz in Gaarden.
New listings are higher: according to the housing market profile from the Investitionsbank Schleswig-Holstein, the median asking rent for existing flats in 2024 was €10.05/m². Our calculator can show you which rent makes a particular flat profitable.
Enter the purchase price and actual rent, and the calculator will show you the gross and net rental yield.
04Population, households and the labour market by district
For landlords, who lives in a district and how they live are what counts. Between the end of 2015 and the end of 2023, Kiel's population grew from around 246,300 to around 250,400 residents (+1.7%). The fastest-growing areas were the small city centre districts of Altstadt and Vorstadt, with new housing, along with Moorsee, Neumühlen-Dietrichsdorf and Gaarden-Ost. Districts that have seen a slight decline include Suchsdorf, Hasseldieksdamm and Schilksee.
Most single people live around the university and the city centre: 75.4% of households in Ravensberg, 73.6% in Brunswik, and 73.4% in Damperhof are single-person households. In the districts on the outskirts, such as Meimersdorf, Moorsee or Russee, the figure is less than 40%. Schilksee on the outer Förde is a special case: 45% of its residents are 65 or older.
Regarding the social structure, we only cite official figures. At the end of 2023, the proportion of unemployed people among residents aged 15 to 64 ranged from 1.8% in Altstadt to 13.8% in Gaarden-Ost, with Mettenhof at 10.9% and Exerzierplatz at 10.6%. This describes differences in the tenant demographic, not the quality of the districts. For your letting business, what matters is the individual household, which you should check during the tenant selection process.
05Four location types for buy-to-let investors
Instead of a ranking, we assign the districts to four types. Each type is suited to different investors.
Type 1: City centre and university districts on the west bank
Ravensberg, Brunswik, Damperhof, Schreventeich, Exerzierplatz, Blücherplatz and Südfriedhof are priced between around €2,750 and €4,000/m². Here, the Christian-Albrechts-Universität, the university hospital and the city centre are all nearby, and many buildings date from the late 19th century and the interwar period. Almost three out of four households are single-person households, and around one in three residents is between 18 and 29.
- You want to let small flats to students, hospital staff and young professionals.
- You carefully inspect the sinking fund, roof and pipework of older buildings.
- Broad demand is more important to you than immediate rental yield.
- You expect a positive cash flow from the rent.
- You are looking for long-term tenancies without frequent changes.
Type 2: Förde locations in the north
Düsternbrook, Wik and Holtenau are priced between around €3,150 and €5,750/m². Düsternbrook, with its villas and large flats, has very few sales. Wik, with around 20,000 residents, is one of the largest districts, home to a naval base and close to the university. Holtenau, on the Kiel Canal, is quieter and has an older demographic.
- You want to let to professionals, couples and members of the armed forces.
- You check the property's address in the street directory to determine its residential location category.
- You want to use a lot of equity and hold for the long term.
- You are looking for the lowest entry price.
- You expect the price of a prime villa location to apply to every address in the district.
Type 3: The east bank
Gaarden-Ost, Gaarden-Süd/Kronsburg, Ellerbek, Wellingdorf, Neumühlen-Dietrichsdorf and Elmschenhagen are priced between around €2,150 and €3,050/m². The east bank is characterised by shipyards, late 19th-century buildings in Gaarden, and post-war housing estates. Gaarden-Ost has the highest proportion of unemployed people in the city and is a designated regeneration area. The planned first tram line is set to run from Wellingdorf to the university, with construction from 2030 and operation from 2034, according to the city.
- You are looking for a lower entry price and are calculating with the official rent index.
- You have detailed knowledge of the building, the owners' association and the street.
- You have experience with letting and property management.
- You are buying a flat for the first time and have little time to spare.
- You are basing your calculations on an infrastructure project with an open-ended schedule.
Type 4: The west and north, including Mettenhof
Mettenhof, Hassee, Russee, Suchsdorf, Wellsee, Pries and Schilksee are priced between around €2,100 and €3,100/m². Mettenhof is a large housing estate from the 1960s and 1970s with around 20,000 residents, the lowest average price in the city, and several major streets in the 'basic' residential location category, such as Skandinaviendamm, Göteborgring and Stockholmstraße. Many older people and families live in Suchsdorf, Russee and Schilksee, and the proportion of single-person households is low.
- You want to let larger flats to couples and families.
- In Mettenhof, you carefully check the service charge, sinking fund and minutes of large property complexes.
- You factor in the discount for 'basic' residential locations.
- You are primarily looking for students as tenants.
- You equate a low price with a high yield.

06Sample calculation: the same flat in three locations
Let's take Jan. He is an employee, single, and has a taxable income of €60,000. He buys a tenanted two-room flat of 55 m², built between 1961 and 1977, and compares three locations: Wik (good residential location, e.g. Feldstraße 143 to 177), Elmschenhagen on the east bank (normal residential location, e.g. Elmschenhagener Allee), and Mettenhof (basic residential location, e.g. Skandinaviendamm). In all three districts, the flats sold were, on average, built around 1960 to 1970. The name is fictional; the figures are a sample calculation and not a forecast.
For the purchase price, we use the average price for the district in 2025 according to the Valuation Committee. For the rent, we use the 2025 rent index: €8.10/m² base rent for 55 m², minus 9% for the construction year. In Wik, a 5% surcharge is added for the good location (€7.78), in Elmschenhagen it remains at €7.37, and in Mettenhof, 12% is deducted for the basic location (€6.40). Because Kiel does not have a rent brake, a higher rent would also be possible if the property were re-let.
| Wik | Elmschenhagen | Mettenhof | |
|---|---|---|---|
| Purchase price per m² (avg. sales 2025) | €3,150 | €2,350 | €2,100 |
| Purchase price 55 m² | €173,250 | €129,250 | €115,500 |
| Grunderwerbsteuer (property transfer tax) 6.5% | €11,261 | €8,401 | €7,508 |
| Notary and land register (approx. 1.8%) | €3,118 | €2,326 | €2,079 |
| Total cost | €187,629 | €139,977 | €125,087 |
| Net rent per m² (Rent Index 2025) | €7.78 | €7.37 | €6.40 |
| Annual net rent | +€5,135 | +€4,864 | +€4,224 |
| Service charge, non-apportionable | −€924 | −€924 | −€924 |
| Interest (3.8%) | −€6,584 | −€4,912 | −€4,389 |
| Principal repayment (2%) | −€3,465 | −€2,585 | −€2,310 |
| Cash flow before tax | −€5,838 | −€3,557 | −€3,399 |
| Depreciation 2% on 75% of total costs | €2,814 | €2,100 | €1,876 |
| Taxable result from letting | −€4,725 | −€2,610 | −€2,503 |
| Tax savings (2026 tariff) | +€1,785 | +€995 | +€955 |
| Cash flow after tax | −€4,053 | −€2,562 | −€2,444 |
| per month | approx. −€340 | approx. −€215 | approx. −€205 |
| Gross rental yield | 3.0% | 3.8% | 3.7% |
In all three locations, Jan has to put money in every month. In Wik, it's around €340 after tax, of which around €290 is principal repayment that reduces his outstanding debt. In Elmschenhagen and Mettenhof, it's around €215 and €205; without the principal repayment, the balance in those locations would be close to zero.
The comparison between Elmschenhagen and Mettenhof is noteworthy. Although Mettenhof is around €250/m² cheaper, the basic residential location costs 12% in rent. On balance, both are almost on a par, with the gross rental yield in Elmschenhagen even being slightly higher. So, the lowest purchase price does not automatically lead to the best calculation.
This calculation is not a recommendation for any one location. It shows how purchase price and residential location category interact. A smaller flat would have a higher comparable rent per square metre; a 30 m² apartment would have a base rent of €9.98/m² according to the rent index. The guide Tax on rental income shows how high the tax saving would be for your income level.
07Risks in choosing a location in Kiel
Every location has its own risks. Some apply to all of them.
- Average instead of individual case: The district prices are a mix of construction years and sizes, and in small districts they are based on fewer than ten sales. The average is a starting point, not a price for your specific flat.
- Residential location and rent increase cap: The location of the address determines a discount of up to 12% or a surcharge of up to 16%. In existing tenancies, the rent can only be increased by a maximum of 15% within three years.
- Rules can change: Kiel currently has no rent brake. Whether the state will reintroduce it is a matter of political debate. Do not base your calculations on rents for new lets that are far above the rent index.
- Student demand: Small flats on the west bank depend on the university and the university of applied sciences. More frequent tenant changeovers cost time and money.
- Interest rates: With gross yields of between 3.0% and 3.8%, every percentage point change in interest rates has a major impact on the calculation.
- Old housing stock and large complexes: In Mettenhof, Elmschenhagen and on the east bank, there are many buildings from the 1950s to the 1970s; on the west bank, there is a lot of pre-war housing stock. New windows, pipes or heating systems will affect the sinking fund and service charges.
08Other locations
You can find the figures for Kiel as a whole, the rules for landlords and a new-build calculation on our page Buy-to-let properties in Kiel. We also compare the northern districts for Hamburg and Bremen. Other cities in the state are covered in the Schleswig-Holstein overview, and all cities in the City Comparison 2026.
FAQFrequently asked questions
Which Kiel district is best for property investors?
There is no single 'best' district. Ravensberg, Brunswik and Schreventeich have the most young tenants but high prices. Entry prices are lower on the Ostufer (east bank) and in Mettenhof, but property and tenant selection require more care. Families and older people tend to rent in the suburbs. The deciding factors are your budget, your holding period and the individual flat.
Where are flats in Kiel cheapest?
In 2025, the lowest average prices for resale flats were in Mettenhof (approx. €2,100/m²), Ellerbek (approx. €2,150/m²) and Gaarden-Ost (approx. €2,200/m²). The highest prices were in Düsternbrook, the Altstadt and the Vorstadt, all of which had few sales.
How many districts does Kiel have?
Kiel has 30 districts, from the Altstadt (number 1) to Rönne (number 30). The city publishes its statistics and the Gutachterausschuss (property valuation committee) publishes its purchase prices at this district level.
Is there a rent cap (Mietpreisbremse) in Kiel?
No. Schleswig-Holstein abolished the Mietpreisbremse (rent cap) in 2019. However, Kiel does have a Kappungsgrenze (capping limit) of 15% over three years for existing tenancies.
What is the rental yield in Kiel's districts?
In our example calculation using rents from the Mietspiegel (rent index), the gross rental yield is between 3.0% in Wik and 3.8% in Elmschenhagen. With a higher existing rent, the yield would be higher.
Is a flat in Mettenhof a worthwhile buy-to-let investment?
Mettenhof has the city's lowest average prices and a high volume of sales. However, many addresses are in a 'simple' residential category with a 12% rent reduction, and the unemployment rate is high. In our calculation, Mettenhof is therefore almost on a par with Elmschenhagen. It is more suitable for investors with letting experience who can carefully assess large housing estates.
Which Kiel districts are growing?
Between the end of 2015 and the end of 2023, the small districts of Altstadt, Vorstadt and Moorsee saw the highest percentage growth. Among the larger districts, Neumühlen-Dietrichsdorf (+5.5%), Gaarden-Ost (+5.0%), Hassee (+4.4%) and Wik (+4.3%) grew the most.
09Further reading
- Buy-to-let properties in Kiel: figures and locations
- Freehold flat as a buy-to-let investment: pros and cons
- Tax on rental income
- Rental Yield Calculator
- Property Purchase Cost Calculator
- Property transfer tax in Schleswig-Holstein
10Sources
All sources accessed on 16 October 2026.
- Committee of Valuation Experts for Property Values in the State Capital Kiel, Property Market Report 2026 (reporting year 2025): Resales of freehold flats by district (Table 7.1.4.1), price index (Table 7.1.5)
- State Capital Kiel, Open Data Kiel: Residents in the districts, residents by age group in the districts, households by household type in the districts, unemployed in the districts (all as of 31 December 2023)
- State Capital Kiel, Kiel Rent Index 2025: Tables 2, 3 and 7, street directory of residential locations
- Investitionsbank Schleswig-Holstein, Housing Market Profile 2025 State Capital Kiel (asking rents 2024)
- State Capital Kiel, Tram planning in Kiel, 2025
- Schleswig-Holstein Ordinance on Rent Increase Caps of 25 March 2024 (GVOBl. Schl.-H. 2024 p. 308); § 5 WiStG
- § 32a EStG (2026 tariff), § 7 EStG (Depreciation), § 558 BGB (Rent increase cap), Property transfer tax Schleswig-Holstein 6.5%
- Percentages, gross rental yields and sample calculation: own calculation, as of 16 October 2026
Disclaimer: This page provides general information and does not constitute investment, tax or legal advice. All figures are cited with their source and date; the sample calculation is based on disclosed assumptions and is not a forecast. As of 16 October 2026.
Writes about Taxes, AfA (depreciation), Existing properties and Portfolio building.
Since 2020, Eduard has bought seven properties of his own and supported more than 150 clients. He writes about tax levers, property documents and portfolio building – with honest numbers instead of rosy projections.
This guide does not replace tax or legal advice. All figures are example calculations with disclosed assumptions.