Investment Property in Bottrop: Figures, Locations and an Honest Calculation
Existing flats for around €1,600/m², rents that support those prices, and a property valuation committee that publishes prices by construction year and location. Set against this are 6.5% property transfer tax and a city with more outbound than inbound commuters.
 Romolo Marini
Investment Advisor at InvestImmo
Bottrop lies in the northern Ruhr region, between Essen, Gladbeck and Oberhausen. Anyone looking for a flat as an investment here will find prices that buyers in southern Germany can only dream of: an existing flat from the 1970s cost around €1,600/m² on average in 2024 and 2025.
Low prices alone, however, do not make a good investment. What matters is whether the rent supports the purchase price, how stable demand is and what taxes are payable on purchase. The city's Gutachterausschuss publishes unusually detailed data on these matters. We have brought the figures together and set out our calculations transparently.
01Bottrop in figures
All the figures we use for our assessment, with sources and reference dates.
| Indicator | Value | Source, reference date |
|---|---|---|
| Residents (official figure) | 118,482 | Statistisches Bundesamt, municipality register, 31.12.2025 |
| Residents in 2015 (based on the 2011 Census) | 117,143 | Statistisches Bundesamt, 31.12.2015 |
| Forecast for 2023–2045 | −1.8% | IT.NRW, population projection 2024–2050 |
| Households | 56,617 | 2022 Census |
| Share of single-person households | 40.9% | 2022 Census |
| Housing stock | 59,570 | 2022 Census |
| Vacancy rate | 3.1% | 2022 Census, reference date 15.05.2022 |
| Share of rented homes | 60.7% | 2022 Census, own calculation |
| Employees subject to social security contributions working in the city | 33,356 | Bundesagentur für Arbeit, 30.06.2025 |
| Inbound / outbound commuters | 18,733 / 29,666 | Bundesagentur für Arbeit, 30.06.2025 |
| Unemployment rate | 8.2% | Bundesagentur für Arbeit via Deutschlandatlas, annual average for 2025 |
| Average rent under existing contracts | €6.10/m² | 2022 Census |
| Rent index, construction years 1949–1977 | Average €6.45/m² | Bottrop rent index, as at 01.01.2025 |
| Advertised rent (reletting) | €8.48/m² | BBSR via Deutschlandatlas, 2025 |
| Purchase price of a flat built in 1970–1979, average location | €1,644/m² | Gutachterausschuss Bottrop, transactions in 2024/2025 |
| Purchase price of a new-build flat | €5,104/m² | Gutachterausschuss Bottrop, 2025 |
| Individually owned flats sold | 312 | Gutachterausschuss Bottrop, 2025 |
| Rent brake | No | Not covered by the North Rhine-Westphalia Tenant Protection Ordinance |
| Cap on rent increases | 20% | Section 558(3) of the German Civil Code (BGB) |
| Property transfer tax in North Rhine-Westphalia | 6.5% | Since 01.01.2015 |
02Population and demand
Bottrop officially had 118,482 residents at the end of 2025, slightly more than in 2015 (117,143). The city's population has therefore remained virtually stable over ten years. According to Deutschlandatlas, it grew by an average of 0.14% a year between 2019 and 2024; in 2024, more people moved in from other parts of Germany than moved away.
IT.NRW forecasts a slight decline in the future. The population is expected to remain roughly unchanged until 2035, then fall to 1.8% below its 2023 level by 2045. Meanwhile, the number of people aged over 65 is rising significantly.
Bottrop is not a typical city of renters. Only 40.9% of households consist of one person, and 37.5% of homes are owner-occupied. Demand for rented flats here comes more from couples, families and older people than from students.
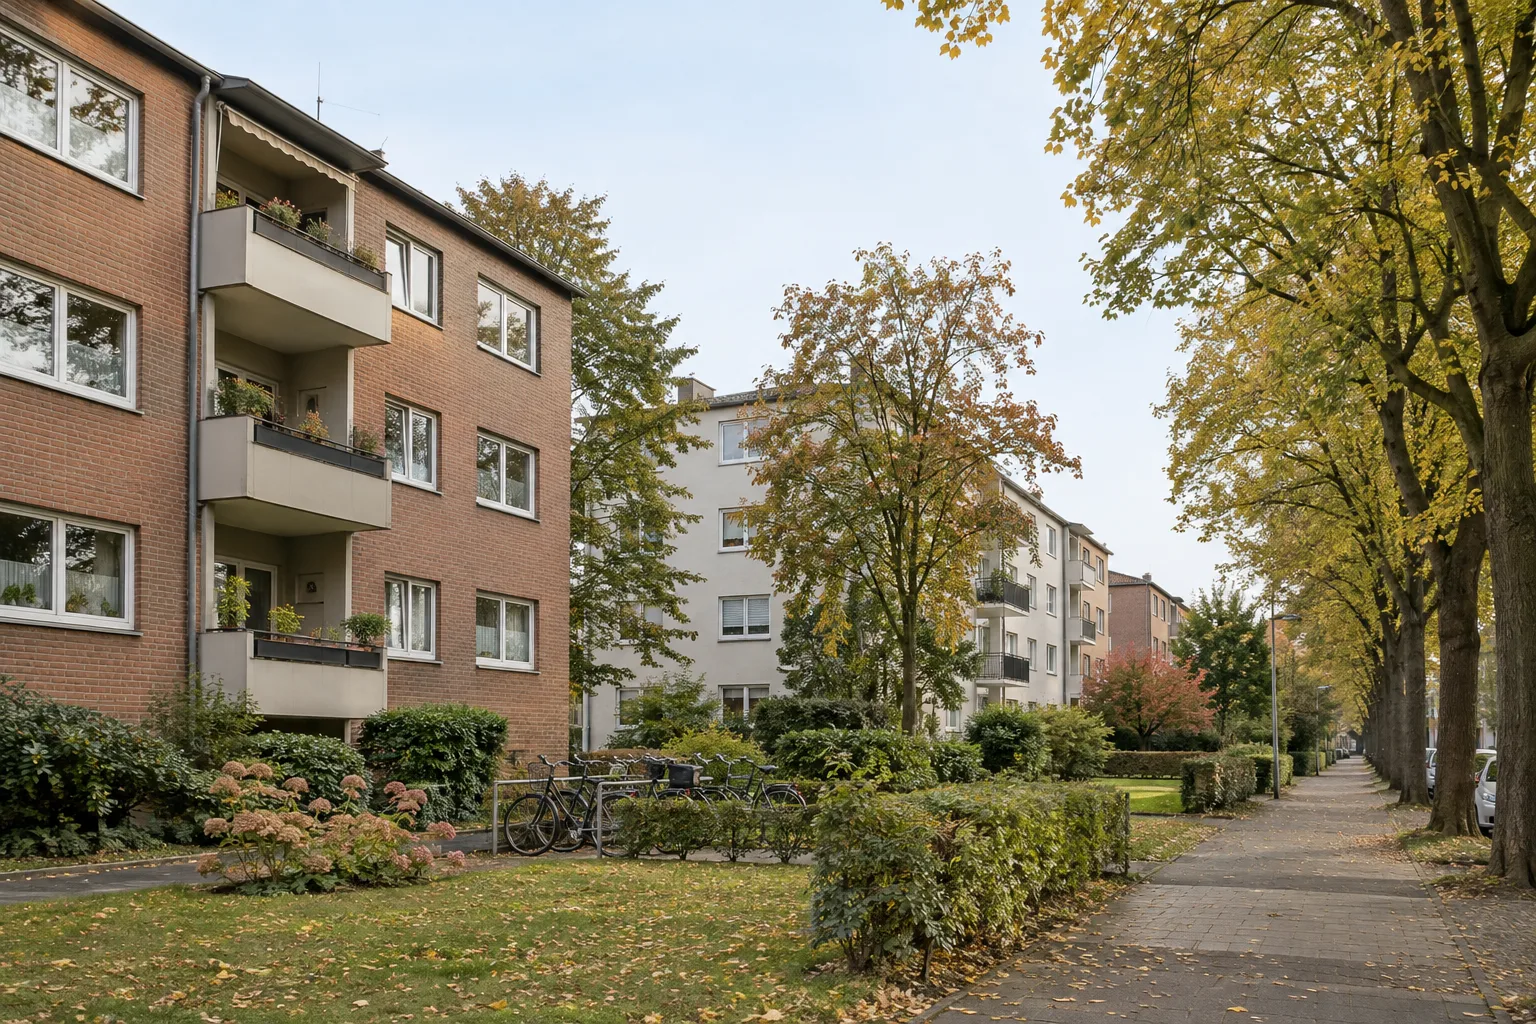
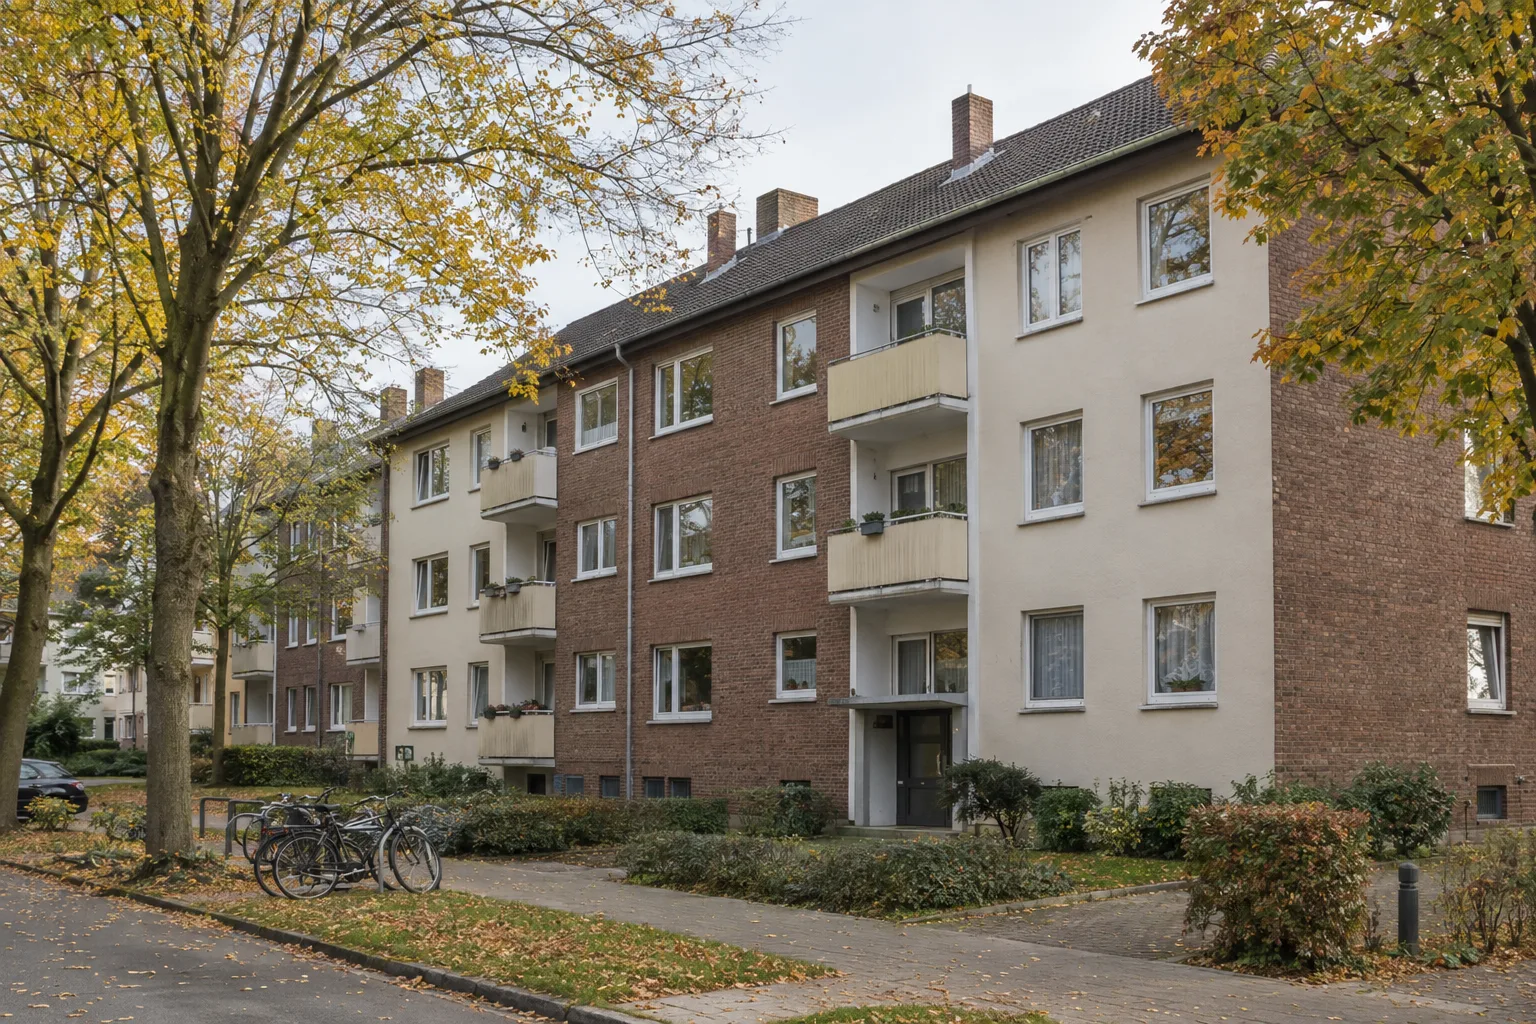
The age of the buildings is striking. The largest construction-period category in the census is the 1950s, with 12,232 homes, just over one in five of the city's homes. Buyers here often purchase a building from the post-war reconstruction period and should inspect the roof, windows, pipework and heating carefully.
03Economy and labour market
Bottrop is primarily a residential city. On 30.06.2025, 44,267 employees subject to social security contributions lived in the city, but only 33,356 worked there. Every day, 29,666 people commute out and 18,733 commute in. Many Bottrop residents work in neighbouring cities in the Ruhr region.
A surplus of outbound commuters need not be a disadvantage for landlords. It shows that Bottrop is a sought-after place to live in the Ruhr region, offering shorter journeys to Essen and Oberhausen and lower rents. Demand therefore also depends on the economies of neighbouring cities. At the end of 2018, the Prosper-Haniel colliery in Bottrop, Germany's last hard-coal mine, closed.
The unemployment rate averaged 8.2% in 2025. This is well above the national average, but is not an outlier for the Ruhr region. Some tenants have tight budgets, and there are limits to how much rent they can afford.
04Rents, purchase prices and rental yields
The city of Bottrop, together with the Gutachterausschuss, publishes a rent index, dated 01.01.2025. It provides guideline rents for flats of 60 to 90 m² in average locations: an average of €6.45/m² for construction years 1949 to 1977, €7.21/m² for 1978 to 1994 and €8.14/m² for 1995 to 2016. Within each age category, the figure rises by 2 to 5 cents for each successive construction year. A flat built in 1974 therefore comes to €6.67/m².
The Gutachterausschuss itself considers the rent index slightly too low. Because it analyses rents from the past six years, the committee applies a 10% uplift for market rents. According to BBSR, advertised rents averaged €8.48/m² in 2025.
Purchase prices in Bottrop are well documented. The 2026 Property Market Report gives average prices from transactions in 2024 and 2025, broken down by construction year and residential location. In blocks with 4 to 19 flats in average locations, flats built between 1970 and 1979 cost an average of €1,644/m², those from the 1990s €2,240/m² and those built from 2010 onwards around €3,571/m². New-build flats cost an average of €5,104/m² in 2025.
For comparison, the Gutachterausschuss provides a price-to-rent ratio based on actual sales of rented flats. In 2025, it averaged 18.9, equivalent to a gross rental yield of around 5.3%. Our calculation therefore falls within a realistic range. You can calculate your own figure using the rental yield calculator.
05Neighbourhoods at a glance
There are no official purchase prices for individual neighbourhoods. However, the Gutachterausschuss distinguishes between basic, average and good residential locations. A flat from the 1970s cost €1,553/m² in a basic location and €1,734/m² in a good one. Standard land values for residential building land average €410/m² in good locations and €215/m² in basic locations.
| Neighbourhood | Character | Better suited to |
|---|---|---|
| Stadtmitte | City centre with shopping streets and a bus station, densely built-up | Single people, older people without a car |
| Eigen | North of the city centre, mixed residential development | Couples, families |
| Fuhlenbrock | Western neighbourhood, quieter, many single-family and two-family houses | Families |
| Batenbrock and Boy | East of the centre, former mining estates and blocks of flats | Low-cost entry; inspect the condition carefully |
| Welheim and Ebel | Southern neighbourhood by the Emscher and the Rhine–Herne Canal | Working people, commuters |
| Kirchhellen | Village-like north, distinctly more rural | Families, longer tenancies |
| Grafenwald | Residential area near woodland in the north | Families |
The difference between basic and good locations is just over 10% for existing flats and 6 quality points in the rent index, equivalent to just under €0.50/m². Location matters, but less than construction year and condition.
06Rules for landlords in Bottrop
Bottrop is not one of the 57 municipalities covered by the North Rhine-Westphalia Tenant Protection Ordinance. This has consequences:
- No rent brake: For a new letting, the rent can be freely agreed. The only limits are the prohibition on excessive rents (Section 5 of the Economic Offences Act) and rent profiteering.
- Rent increase cap of 20%: Under an existing tenancy agreement, the rent may rise by no more than 20% over three years, and never above the local comparable rent.
- No extended protection period against termination: Following conversion into individually owned flats, the statutory three-year period applies.
When buying in North Rhine-Westphalia, you pay 6.5% property transfer tax, one of the highest rates in Germany. Notary and land registry fees add around 2.1% of the purchase price if you are using financing, plus an estate agent’s fee depending on the property. At a purchase price of €106,860, this means purchase costs of around 8.6%, excluding an estate agent. The purchase costs calculator calculates your own costs, while our article on notary fees explains the individual notary charges.
07Worked example: a tenanted flat in Bottrop
Take Kerstin, 47, single, an administrator with a taxable income of €60,000. She buys a tenanted 65 m² flat in a block built in 1974 in an average location for €106,860. This corresponds to the average price reported by the Gutachterausschuss (€1,644/m²). At €6.67/m², the rent is exactly in line with the rent index. The name is fictional, and the figures are a worked example, not a forecast.
| Purchase price (65 m² × €1,644/m²) | €106,860 |
|---|---|
| North Rhine-Westphalia property transfer tax at 6.5% | €6,946 |
| Notary and land registry (with a land charge of €106,860) | €2,204 |
| Purchase costs paid from equity | €9,150 |
| Loan (purchase price) | €106,860 |
| Interest at 3.8% and principal repayment at 1.5% (assumption) | €5,664 per year |
| per year | per month | |
|---|---|---|
| Net rent excluding service charges (€6.67/m², 2025 rent index) | €5,203 | €434 |
| Interest | −€4,061 | −€338 |
| Principal repayment | −€1,603 | −€134 |
| Non-recoverable costs (management, reserve fund, assumption) | −€1,320 | −€110 |
| Cash flow before tax | −€1,781 | −€148 |
| Depreciation at 2% on the building component (80%, assumption) | €1,845 | €154 |
| Rental loss (rent − interest − costs − depreciation) | −€2,023 | −€169 |
| Tax saving (2026 tax rates, excluding church tax) | +€774 | +€65 |
| Cash flow after tax | −€1,007 | −€84 |
Kerstin contributes around €84 a month after tax while repaying €134 of principal. Without principal repayments, there would be a surplus of around €50 a month. Here, the rent covers interest and running costs.
The price she pays for this is the purchase costs. Kerstin pays just over €9,000 from equity, of which almost €7,000 is property transfer tax. This is recovered only in part, and over decades, through depreciation. Our article on taxing rental income explains how rental income is taxed.
Because the purchase price is low, interest has less of an impact than in expensive cities. Vacancy and maintenance therefore carry all the more weight. A special levy for a new roof on a building from the 1970s can cost several years’ worth of surpluses.
For comparison: a new-build flat in Bottrop
What changes if Kerstin buys a newly built 45 m² flat instead? For new-build flats in 2025, the Gutachterausschuss recorded an average price of €5,104/m², with an average living area of 80 m². For 45 m², that gives a price of €229,680. She pays property transfer tax (€14,929) and notary and land registry fees (€3,819) from equity. We assume a rent of €9.38/m², the rent index figure for properties built in 2025. The rent index explicitly excludes first-occupancy rents, so the actual initial rent may be higher.
| per year | per month | |
|---|---|---|
| Net rent excluding service charges (45 m² × €9.38/m², rent index) | €5,065 | €422 |
| Interest (3.8% on €229,680) | −€8,728 | −€727 |
| Principal repayment (1.5%) | −€3,445 | −€287 |
| Non-recoverable building service charges (€1.20/m², assumption) | −€648 | −€54 |
| Cash flow before tax | −€7,756 | −€646 |
| Declining-balance depreciation at 5% on the building component (80%, assumption) | €9,889 | €824 |
| Rental loss (rent − interest − building service charges − depreciation) | −€14,199 | −€1,183 |
| Tax saving (2026 tax rates, excluding church tax) | +€5,130 | +€428 |
| Cash flow after tax | −€2,626 | −€219 |
Depreciation in the first year is more than five times as high as for the existing flat (€9,889 rather than €1,845), and maintenance costs are usually minimal in the first few years. However, the price per square metre is three times as high, and the gross rental yield falls from 4.9% to around 2.2%. Before tax, Kerstin contributes around €646 a month; after tax, around €219, more than twice as much as for the existing flat. Property transfer tax rises with the purchase price to almost €15,000. The tax saving becomes smaller in subsequent years because declining-balance depreciation is calculated on the remaining value.
08Opportunities and risks in Bottrop
There are evidence-based arguments in Bottrop’s favour. Purchase prices and rents are well aligned, gross rental yields for existing flats are around 4.5 to 5%, and the Gutachterausschuss confirms this with a purchase price-to-annual rent ratio of 18.9. The vacancy rate was low at the time of the census, and the population has been stable for years. There is no rent brake.
The drawbacks are equally clear:
- 6.5% property transfer tax: Ancillary purchase costs exceed 8% without an estate agent.
- Older building stock: The largest share of buildings dates from the 1950s, making refurbishment and special levies more likely.
- Unemployment rate of 8.2%: Some tenants have tight budgets.
- Forecast of −1.8% by 2045: Demand is not growing.
- An out-commuter city: Demand depends on jobs in neighbouring cities.
- Interest rates and vacancies: Every month a property stands empty costs you the full rent, while a higher refinancing rate increases the amount you need to contribute.
- You are looking for a low monthly top-up contribution.
- You can cover the higher ancillary purchase costs from your own funds.
- You carefully check the condition, reserve fund and minutes of owners’ meetings.
- You are comfortable dealing with tenants on middle incomes.
- You are banking on a growing city.
- You are wary of refurbishment risks.
- You have no reserves for a special levy.
- You depend on a particular level of capital appreciation.
For the general advantages and disadvantages of investing in a flat, see our article A flat as an investment.
09Other locations
Other cities in North Rhine-Westphalia: Overview of North Rhine-Westphalia · Aachen · Bielefeld · Bochum · Bonn · Dortmund · Duisburg · Düsseldorf · Essen · Gelsenkirchen · Gütersloh · Hamm · Krefeld · Köln · Leverkusen · Mönchengladbach · Mülheim an der Ruhr · Münster · Neuss · Oberhausen · Paderborn · Recklinghausen · Siegen · Solingen · Troisdorf · Wuppertal
All locations compared: Where is property investment worthwhile? Cities compared in 2026 · Which federal state is suitable? All 16 compared
FAQFrequently asked questions
Is a flat in Bottrop worthwhile as an investment?
On the figures, Bottrop is one of the locations where an existing flat bought with mortgage finance almost pays for itself. In our example, you contribute around €84 a month after tax and repay €134 of the mortgage principal. In return, you accept high purchase costs, older buildings and a stagnating population.
What is the rental yield in Bottrop?
Around 4.5 to 4.9% gross for flats built in the 1970s with rents at rent-index or census levels. Based on actual sales of tenanted flats, the property valuation committee calculated a purchase price equivalent to 18.9 times the annual rent, corresponding to around 5.3%. New-build flats yield around 2.2%.
How much does a flat cost to buy in Bottrop?
According to the property valuation committee, flats in multi-family buildings in average locations cost around €1,250/m² for construction years up to 1969, €1,644/m² for the 1970s, €2,240/m² for the 1990s and around €3,570/m² from 2010 onwards. New-build flats cost an average of €5,104/m² in 2025.
Does Bottrop have a rent brake?
No. Bottrop is not among the municipalities covered by the North Rhine-Westphalia Tenant Protection Ordinance. For a new tenancy, the rent can be freely agreed, subject to the rules on excessive rents and rent profiteering. During an existing tenancy, the cap on rent increases is 20% over three years.
Does Bottrop have a rent index?
Yes. The city publishes a rent index jointly with the property valuation committee and the associations, dated 1 January 2025. It lists indicative rents by building age, ranging from €6.01/m² for buildings constructed up to 1948 to €9.15/m² for buildings constructed from 2017 onwards, plus additions and deductions for size, amenities and location.
Which districts in Bottrop are of interest to property investors?
That depends on the target tenant group. The city centre matters to tenants without a car, while families are more likely to favour Eigen, Fuhlenbrock or Kirchhellen. Batenbrock and Boy offer low entry prices, but the condition of the buildings is particularly important there. The price difference between basic and good locations is just over 10%.
How high are the additional purchase costs in Bottrop?
Property transfer tax in North Rhine-Westphalia is 6.5%. For lower-priced purchases with mortgage finance, notary and land registry fees amount to around 2%. On a purchase price of €106,860, additional costs excluding estate agent fees are around €9,150, or 8.6%.
10Further reading
- A flat as an investment: advantages and disadvantages
- Paying tax on rental income
- Notary fees when buying property
- Special depreciation allowances and declining-balance depreciation
- Rental yield calculator
- Ancillary purchase costs calculator
- Property transfer tax in North Rhine-Westphalia
11Sources
All sources accessed on 15 October 2026.
- Gutachterausschuss für Grundstückswerte in der Stadt Bottrop, Property Market Report 2026 (reporting period: 2025), Chapter 6.1 (flat ownership, gross income multipliers) and local rent index as at 1 January 2025
- IT.NRW on behalf of MWIKE NRW, Population projections for North Rhine-Westphalia from 2024 to 2050/2070
- Statistisches Bundesamt, register of municipalities, municipalities as at 31 December 2015 and 31 December 2025
- Statistische Ämter des Bundes und der Länder, 2022 Census (reference date: 15 May 2022): Regional table of buildings and dwellings and Regional table of households
- Bundesagentur für Arbeit, Municipal data on employees subject to social insurance contributions by place of residence and work, reference date: 30 June 2025
- BBSR and Bundesagentur für Arbeit via Deutschlandatlas, data tables (asking rents in 2025, unemployment rate in 2025, population trends; as at 25 September 2026)
- Landesregierung NRW, North Rhine-Westphalia Tenant Protection Ordinance (MietSchVO NRW), GV. NRW. 2025 p. 111, amended by GV. NRW. 2025 p. 848 (list of municipalities; Bottrop not included)
- Property transfer tax in North Rhine-Westphalia: 6.5%, Act of 25 July 2011 (GV. NRW. p. 389), as amended on 18 December 2014 (GV. NRW. p. 954)
- Section 556d BGB, Section 558 BGB, Section 577a BGB, Section 32a EStG (2026 tax schedule), Section 7 EStG (subsections 4 and 5a), Section 7b EStG, Section 34 GNotKG (Table B)
- All example calculations, purchase price-to-annual rent ratios and yields: own calculations, as at 15 October 2026
Disclaimer: This page provides general information and does not constitute investment, tax or legal advice. All figures are either example calculations with disclosed assumptions or official figures with their reference dates stated, as at 15 October 2026.
Writes about Financing and Taxes.
Romolo brings almost 17 years of banking and financing experience, including leading around 145 sales staff, to his work. He writes about financing, taxes and property decisions that fit your life for the long term.
This guide does not replace tax or legal advice. All figures are example calculations with disclosed assumptions.