Investment Property in Bocholt: Figures, Locations and an Honest Calculation
Low vacancy, more jobs than resident employees and a new rent index, but purchase prices have outpaced rents. We set out the official figures and work through a tenanted flat.
 Kevin Celentano
Investment Advisor at InvestImmo
Bocholt is the largest town in the district of Borken and lies directly on the Dutch border. With just over 73,000 residents, it is smaller than the cities of the Ruhr region, but has an economy of its own: more employees subject to social security contributions work here than live here. The population has grown over ten years, and only a small number of homes were vacant at the 2022 Census.
For property investors, that sounds like a solid market. However, the figures from the property valuation committee [Gutachterausschuss] also show the other side: existing flats became significantly more expensive in 2025, while rents in the rent index remain moderate. Gross rental yields are therefore closer to 3.5% than 5%. We set out all the figures and work through examples for an existing flat and a new-build flat.
01Bocholt in figures
All the figures used in our assessment, with sources and dates.
| Indicator | Value | Source, date |
|---|---|---|
| Population (official) | 73,048 | Federal Statistical Office, municipal directory, 31 December 2025 |
| Population in 2015 (based on the 2011 Census) | 71,443 | Federal Statistical Office, 31 December 2015 |
| Forecast 2023–2050, district of Borken | −0.7% | IT.NRW, population projection 2024 to 2050/2070 (district figure) |
| Households | 32,971 | 2022 Census |
| Share of single-person households | 37.8% | 2022 Census |
| Housing stock | 34,935 | 2022 Census |
| Vacancy rate | 2.7% | 2022 Census, reference date 15 May 2022 |
| Owner-occupancy rate | 51.9% | 2022 Census |
| Employees subject to social security contributions, by workplace | 32,871 | Federal Employment Agency, 30 June 2025 |
| Inbound / outbound commuters | 14,147 / 11,767 | Federal Employment Agency, 30 June 2025 |
| Unemployment rate, district of Borken | 4.6% | Federal Employment Agency via Deutschlandatlas, 2025 annual average (district figure) |
| Average rent under existing tenancies | €6.57/m² | 2022 Census |
| Rent index, built 1900–1979, 65–85 m² (mean) | €6.44/m² | Qualified rent index 2026 |
| Asking rent, district of Borken | €9.32/m² | BBSR via Deutschlandatlas, 2025 (district figure) |
| Purchase price of existing flat, built 1950–1974 | €2,250/m² | Bocholt property valuation committee, 2025 (14 transactions) |
| New-build purchase price, first sale | €3,940/m² | Bocholt property valuation committee, 2025 (20 transactions) |
| Rent brake [Mietpreisbremse] | no | NRW Tenant Protection Ordinance, list of municipalities |
| Rent increase cap [Kappungsgrenze] | 20% | Section 558 BGB |
| Property transfer tax [Grunderwerbsteuer], North Rhine-Westphalia | 6.5% | NRW state legislation |
02Population and demand
At the end of 2025, Bocholt had 73,048 residents, around 1,600 more than at the end of 2015. As the older figure is still based on the 2011 Census, the comparison is not entirely exact, but the direction is clear. In the last year, the population fell slightly, by just over 200 residents. The district of Borken benefits from net inward migration both from elsewhere in Germany and from abroad.
IT.NRW takes a cautious view of the future. There is no separate population projection for the town itself. For the district of Borken, the state statistical office expects growth of around 2% up to approximately 2035, followed by a population slightly below today's level by 2050 (−0.7%).
Bocholt is a town of owner-occupiers. At the 2022 Census, more than half of homes (51.9%) were occupied by their owners, while only 47.3% were rented out. Just over a third of households consist of one person, a much smaller share than in major cities. The rental market is therefore smaller, with demand mainly coming from working people, young households and older people moving from a detached house into a flat.
03Economy and labour market
Bocholt is an employment centre for the surrounding area. On 30 June 2025, 32,871 employees subject to social security contributions worked in the town, while 30,480 lived there. More people commute in (14,147) than out (11,767). Industry and small and medium-sized businesses shape the economy, with mechanical engineering and drive technology as traditional strengths. Westphalian University of Applied Sciences has a campus in Bocholt.
The district of Borken's unemployment rate averaged 4.6% in 2025; no separate annual figure is available for the town. This is a favourable environment for landlords: low unemployment supports rental demand, and purchasing power in the district, with around €29,300 in disposable income per resident (2023), is higher than in the Ruhr region. Dependence on individual industrial employers is, however, a risk to keep in mind.
04Rents, purchase prices and rental yields
A new qualified rent index has been in force in Bocholt since 1 January 2026 and is valid for two years. It was compiled from a comprehensive survey of landlords reflecting conditions in May 2025. It gives the following mean values for flats between 65 and 85 m²:
Asking rents are higher. For the district of Borken, BBSR reports an average of €9.32/m² for newly advertised flats in 2025; there is no separate figure for Bocholt. At the 2022 Census, tenants in Bocholt paid an average of €6.57/m² under existing tenancies.
Purchase prices come from the property valuation committee's 2026 property market report. In 2025, 132 existing flats were resold. Over the three-year period from 2023 to 2025, flats built between 1950 and 1974 cost an average of €1,980/m², those built between 1975 and 1994 €2,130/m², and those built between 1995 and 2009 €2,700/m². In 2025 alone, prices for flats built between 1950 and 1974 rose to €2,250/m², around 25% above 2024. New-build flats cost an average of €3,940/m² in 2025, 12.6% less than in the previous year.
The purchase price and rent determine the price-to-rent multiple [Kaufpreisfaktor]; its reciprocal is the gross rental yield [Bruttomietrendite].
Only the district's asking rent produces a yield of around 5%. For a flat built in the 1960s in Bocholt, however, this rent is significantly above the upper limit of the rent index (€7.34/m²) and therefore cannot be justified for rent increases. Use the rent index in your calculations instead. Check your own figures with the rental yield calculator.
05Bocholt neighbourhoods at a glance
No official purchase prices or rents are available for individual neighbourhoods in Bocholt. However, the rent index divides the town into four location zones and applies different adjustments: Zone I, with greenery and good connections, receives +€0.71/m². Zone II, the standard and mostly densely built residential area, is the baseline. Zone III, affected by noise or exhaust emissions, receives −€0.10/m², while outlying settlements and rural areas (Zone IV) receive −€0.70/m². The street directory in the rent index shows which zone each street belongs to.
| Area | Character | More suitable for |
|---|---|---|
| Town centre | Centre within the ring road, older buildings and flats above shops | Single people, students, older people |
| Residential areas near the centre | Dense housing around the ring road, much of it post-war | Couples, working people |
| Biemenhorst, Stenern, Lowick | Larger residential areas with blocks of flats and detached houses | Families, longer tenancies |
| Mussum, Fildeken | Residential areas on the outskirts, close to commercial premises | Working people, commuters |
| Outlying districts (Suderwick, Spork, Barlo, Hemden, Liedern) | Village character, predominantly detached houses | Families; a relatively small market for flats |
The difference between the highest- and lowest-rated location zones in the rent index is around €1.40/m², or just over €90 a month for a 65 m² flat. Check the zone before buying and before assuming a particular rent.
06Rules for landlords in Bocholt
Bocholt is not listed in North Rhine-Westphalia's Tenant Protection Ordinance [Mieterschutzverordnung]. This means:
- No rent brake: When granting a new tenancy, you are not bound by the limit of 10% above the local comparable rent.
- Rent increase cap of 20%: During an existing tenancy, rent may rise by no more than 20% over three years, and only up to the local comparable rent [ortsübliche Vergleichsmiete].
- Qualified rent index: You must cite its figures when increasing the rent. It specifies a range for each construction period, such as €5.51 to €7.34/m² for flats built up to 1979.
When buying in North Rhine-Westphalia, you pay 6.5% property transfer tax. Notary and land registry fees apply on top, as may estate agent fees depending on the property. At a purchase price of €146,250, purchase costs excluding estate agent fees are around 8.4%. The purchase costs calculator works out your own costs, while our guide to notary fees explains the individual notary charges.
07Worked example: a tenanted flat in Bocholt
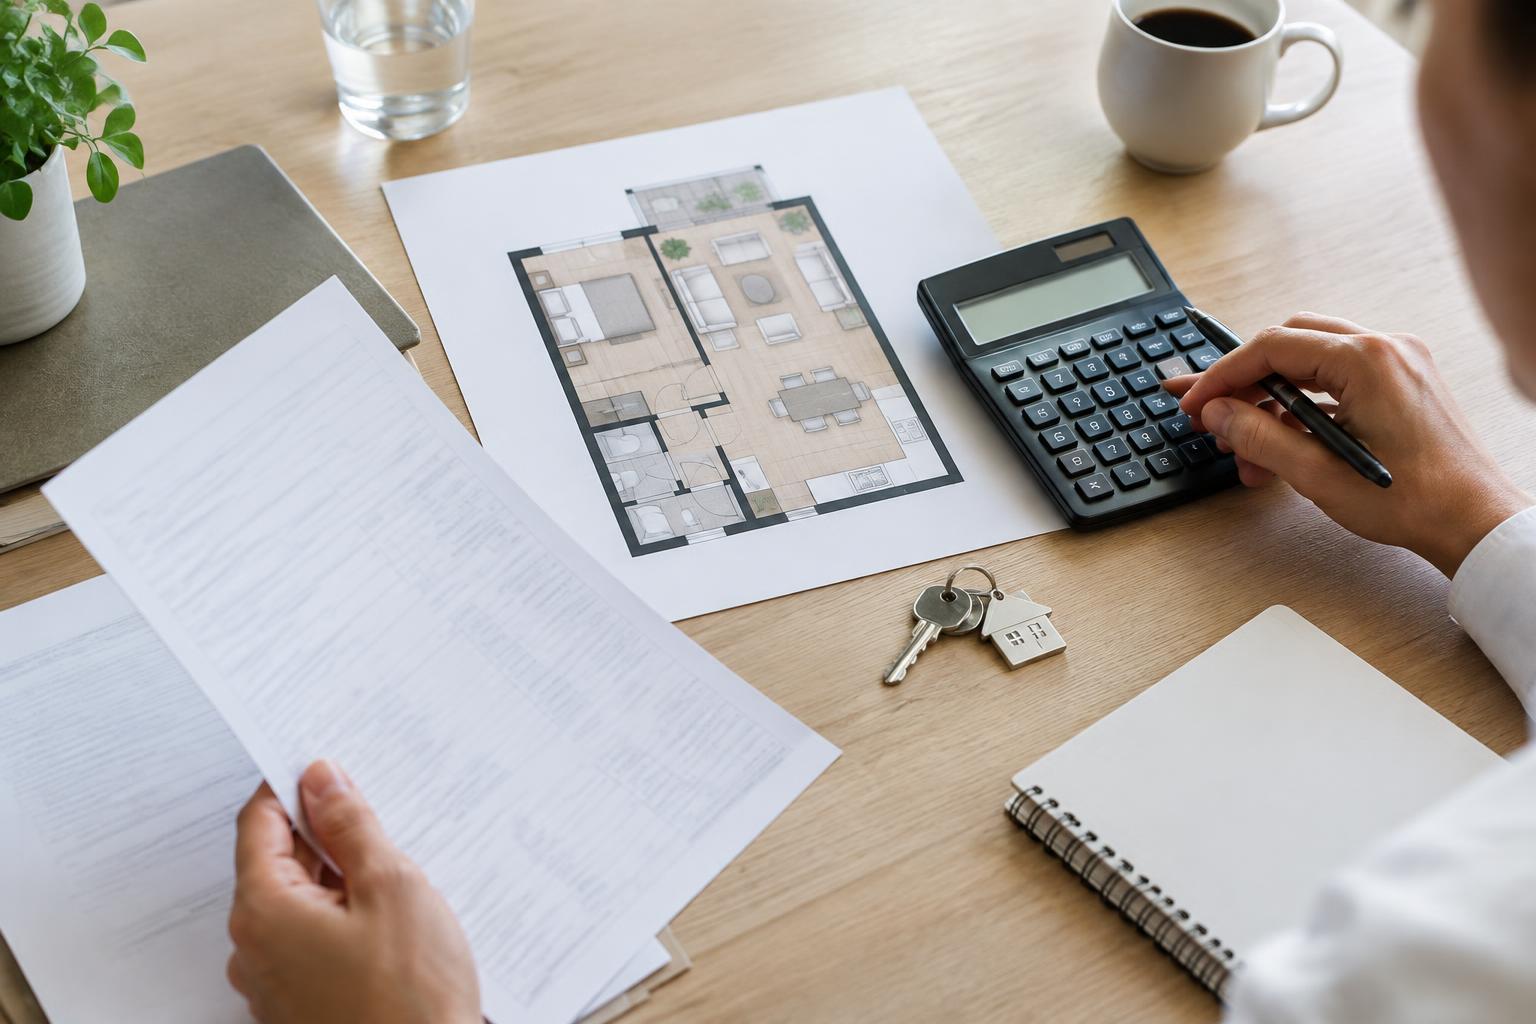
Take Sandra, 37, single, a civil engineer with taxable income of €60,000. She buys a tenanted 65 m² flat, built in 1970, for €146,250. This matches the average 2025 price for flats built between 1950 and 1974 (€2,250/m²). The rent of €6.44/m² is the mean in the 2026 rent index for this construction period, without supplements. The name is fictional, and the figures are a worked example, not a forecast.
| Purchase price (65 m² × €2,250/m²) | €146,250 |
|---|---|
| Property transfer tax, North Rhine-Westphalia, 6.5% | €9,506 |
| Notary and land registry (including a €146,250 land charge [Grundschuld]) | €2,821 |
| Purchase costs [Kaufnebenkosten] paid from equity | €12,328 |
| Loan (purchase price) | €146,250 |
| Interest 3.8% and principal repayment [Tilgung] 1.5% (assumed) | €7,751 a year |
| per year | per month | |
|---|---|---|
| Rent excluding service charges and heating [Nettokaltmiete] (€6.44/m², rent index 2026) | €5,023 | €419 |
| Interest | −€5,558 | −€463 |
| Principal repayment | −€2,194 | −€183 |
| Non-recoverable costs [nicht umlagefähige Kosten] (management, maintenance reserve [Rücklage], assumed) | −€1,320 | −€110 |
| Cash flow before tax | −€4,048 | −€337 |
| Depreciation [Abschreibung] at 2% on the building share (80%, assumed) | €2,523 | €210 |
| Rental loss (rent − interest − costs − depreciation) | −€4,377 | −€365 |
| Tax saving (2026 income tax schedule, excluding church tax) | +€1,656 | +€138 |
| Cash flow after tax | −€2,392 | −€199 |
Sandra contributes around €199 a month after tax. Even without principal repayments, there would still be a small shortfall of around €17 a month. At average figures, rent in Bocholt therefore does not even cover interest and running costs. That is the price of a market with low vacancy and solid demand.
The interest rate has the greatest effect, followed by the purchase price. If Sandra pays the average price of the last three years rather than the 2025 level, her contribution before tax falls by almost €80 a month. When purchase prices have risen by a quarter in a single year, it is worth comparing similar sales closely. Our guide to tax on rental income explains how rental income is taxed.
For comparison: a new-build flat in Bocholt
Bocholt offers an advantage for this comparison: the new rent index includes flats built from 2022 onwards for the first time. For Sandra, we calculate a 45 m² new-build flat at the average price of first sales in 2025 (€3,940/m²). The rent of €10.11/m² is the mean for properties built from 2022 onwards (€9.68/m²) plus the supplement for 45 to 65 m² (€0.43/m²). New-build flats first let after 1 October 2014 would in any case be permanently exempt from the rent brake (Section 556f BGB).
| per year | per month | |
|---|---|---|
| Rent excluding service charges and heating (€10.11/m², rent index 2026) | €5,459 | €455 |
| Interest 3.8% | −€6,737 | −€561 |
| Principal repayment 1.5% | −€2,660 | −€222 |
| Non-recoverable costs (assumed) | −€648 | −€54 |
| Cash flow before tax | −€4,586 | −€382 |
| Declining-balance depreciation [degressive AfA] at 5% on the building share (80%) | €7,641 | €637 |
| Tax saving (2026 income tax schedule) | +€3,533 | +€294 |
| Cash flow after tax | −€1,053 | −€88 |
Before tax, the new build costs more at −€382 a month than the existing flat (−€337); after tax, it costs significantly less at −€88 compared with −€199. This is due to the higher depreciation allowance. Its gross yield of 3.1% is lower than that of the existing flat (3.4%), but fewer repairs are usually needed in the first few years, and new-build prices fell in 2025 while prices for existing flats rose. As declining-balance depreciation decreases each year, the tax benefit diminishes over time.
An additional special depreciation allowance [Sonder-AfA] under Section 7b EStG may be available if, among other conditions, the property meets the Efficiency House 40 [Effizienzhaus 40] standard with QNG certification, construction costs do not exceed €5,200/m² and the assessment basis is capped at €4,000/m². It is not included in our calculation. Find out more in our guide to special and declining-balance depreciation, or calculate your own depreciation using the depreciation calculator.
08Opportunities and risks in Bocholt
Bocholt has demonstrable strengths: a growing population over the period, a 2.7% vacancy rate, more jobs than resident employees and low unemployment in the district. The new qualified rent index makes rents verifiable for all construction years up to 2025.
The counterpoints are equally clear:
- Low gross yields: around 3.4% to 3.9% at rent-index levels; an existing flat does not cover its own costs at average figures.
- Sharply higher prices: +25% for flats built between 1950 and 1974 in one year, based on a small number of transactions.
- Small rental market: more than half of homes are owner-occupied.
- Forecast: a slight population decline in the district of Borken by 2050.
- High purchase costs: 6.5% property transfer tax plus notary fees.
- You are looking for a location with low vacancy and stable demand.
- You can afford a monthly contribution over several years.
- You benchmark the rent against the rent index rather than district asking rents.
- You check purchase prices against comparable sales.
- You are looking for a flat that covers its own costs from the first year.
- You rely on rents above the range in the rent index.
- You have no reserve for special levies [Sonderumlagen].
- You depend on a particular level of capital growth.
Our guide to buying a flat as an investment explains the general advantages and disadvantages of investing in an individually owned flat [Eigentumswohnung].
09More locations
More towns and cities in North Rhine-Westphalia: Overview of North Rhine-Westphalia · Aachen · Bergisch Gladbach · Bielefeld · Bochum · Bonn · Bottrop · Dortmund · Duisburg · Düsseldorf · Essen · Gelsenkirchen · Gütersloh · Hagen · Hamm · Herne · Iserlohn · Krefeld · Cologne · Leverkusen · Moers · Mönchengladbach · Mülheim an der Ruhr · Münster · Neuss · Oberhausen · Paderborn · Recklinghausen · Remscheid · Rheine · Siegen · Solingen · Troisdorf · Witten · Wuppertal
Compare all locations: Where is property investment worthwhile? Towns and cities compared in 2026 · Which federal state is suitable? All 16 compared
FAQFrequently asked questions
Is a flat in Bocholt worthwhile as an investment?
At average figures, an existing flat does not cover its own costs. In our example, you contribute around €199 a month after tax. In its favour, vacancy is low and demand is stable. Thanks to declining-balance depreciation, a new build requires a contribution of around €88 after tax.
What rental yield can you expect in Bocholt?
Around 3.4% to 3.9% gross when calculated using the 2026 rent index and the property valuation committee's purchase prices. Using the district of Borken's asking rent would produce around 5%, but that rent is above the rent-index range for older flats.
How much does a flat in Bocholt cost?
In 2025, existing flats built between 1950 and 1974 cost an average of €2,250/m², compared with a three-year average of €1,980/m². Flats built between 1995 and 2009 were around €2,700/m², while new-build flats cost €3,940/m² in 2025.
Does the rent brake apply in Bocholt?
No. Bocholt is not listed in North Rhine-Westphalia's Tenant Protection Ordinance. The general rent increase cap of 20% over three years applies.
Does Bocholt have a rent index?
Yes. Its qualified rent index for 2026 has been valid since 1 January 2026 for a period of two years. For the first time, it also includes new-build flats built from 2022 onwards, with a mean of €9.68/m².
Which neighbourhoods in Bocholt are of interest to property investors?
The town centre and nearby residential areas are relevant for small flats, while Biemenhorst, Stenern and Lowick are more suited to families. The rent index applies a supplement of €0.71/m² for Zone I locations and a deduction of €0.70/m² for outlying settlements and rural locations.
How high are purchase costs in Bocholt?
North Rhine-Westphalia charges 6.5% property transfer tax, with notary and land registry fees of just under 2% on top. At a purchase price of €146,250, costs excluding estate agent fees are around €12,330, or 8.4%.
10Further reading
- Buying a flat as an investment: advantages and disadvantages
- Tax on rental income
- Notary fees when buying property
- Special and declining-balance depreciation
- Rental yield calculator
- Purchase costs calculator
- Property transfer tax in North Rhine-Westphalia
11Sources
All sources accessed on 19 October 2026.
- Property valuation committee for the town of Bocholt, Property market report 2026 (reporting period 2025), Sections 2, 3.4, 6.1.1 to 6.1.3, 9
- Town of Bocholt, Qualified rent index 2026, effective from 1 January 2026, Tables 1 to 6
- IT.NRW on behalf of MWIKE NRW, Population projection for North Rhine-Westphalia 2024 to 2050/2070 (district of Borken)
- Federal Statistical Office, municipal directory, municipalities as at 31 December 2015 and 31 December 2025
- Federal and state statistical offices, 2022 Census (reference date 15 May 2022): Regional table: buildings and dwellings and Regional table: households
- Federal Employment Agency, Municipal data on employees subject to social security contributions by place of residence and workplace, reference date 30 June 2025
- BBSR and Federal Employment Agency via Deutschlandatlas data tables (district of Borken: asking rents 2025, unemployment rate 2025, net migration 2024, disposable income 2023; as at 25 September 2026)
- NRW state government, NRW Tenant Protection Ordinance (MietSchVO NRW), GV. NRW. 2025 p. 111, amended by GV. NRW. 2025 p. 848 (list of municipalities, Bocholt not included)
- Property transfer tax in North Rhine-Westphalia, 6.5%, Act of 25 July 2011 (GV. NRW. p. 389), as amended on 18 December 2014 (GV. NRW. p. 954)
- Section 556d BGB, Section 556f BGB, Section 558 BGB, Section 558d BGB, Section 32a EStG (2026 income tax schedule), Section 7 EStG (subsections 4 and 5a), Section 7b EStG, Section 34 GNotKG (Table B)
- All worked examples, price-to-rent multiples and yields: our calculations, as at 19 October 2026
Note: This page provides general information and does not constitute investment, tax or legal advice. All figures are either worked examples with disclosed assumptions or official figures with a stated reference date. Information as at 19 October 2026.
Writes about Purchase process, Notary and land registry and Letting.
Kevin combines twelve years of sales experience with nine years specialising in property and more than 500 consultations. He writes about property quality, location risks and a safe path from the first comparison to completion.
This guide does not replace tax or legal advice. All figures are example calculations with disclosed assumptions.